 |
 |
 |
| Christina Baaklini Electrical and Computer Engineering Rutgers University |
Michael Collins Electrical and Computer Engineering Rutgers University |
Nicole DiLeo Electrical and Computer Engineering Rutgers University |
Project guided by Wade Trappe, Dola Saha, and Ivan Seskar.
 }}}
'''Update: Raw IQ Samples and Processing in MATLAB'''
Next, using the same frequencies and sampling rate as the original tutorial, we modified the OEDL script in order to collect raw time domain samples using ORBIT as opposed to samples that had already been converted into the frequency domain.
[[BR]][[BR]]
We then wrote a MATLAB script entitled "spectro" which we used to convert the raw data into the frequency domain. From there, we again generate a waterfall plot of the data.
[[BR]][[BR]]
Using the raw IQ samples instead of preprocessed FFT data allows for more flexibility in our signal processing. We now have access to a much larger collection of data, and we can produce more accurate frequency domain transforms.
----------
==== Experiment 2: Signal Transmission and Processing with Two Transmitters and One Receiver ====
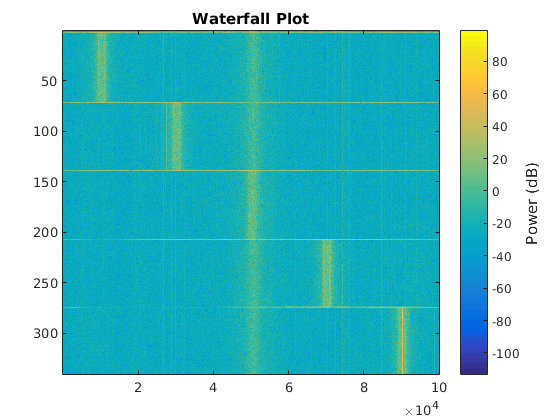
In this experiment, we write an OEDL script that uses two transmitters and one receiver to collect preprocessed FFT samples. Utilizing three USRP2 radios on the grid, two nodes were used as transmitters, and one as a receiver.
[[BR]][[BR]]
The first transmitter starts at a frequency of 798 MHz and increases to 802 MHz, while the second transmitter starts at a frequency of 804 Mhz and increases to 808 MHz all over a span of 2.5 seconds. The receiver has a carrier frequency of 803 MHz and a bandwidth of 12 Mhz.
[[BR]][[BR]]
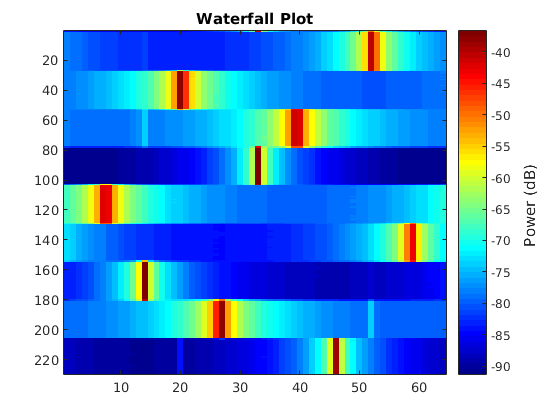
We then save the FFT data from the receiver to our local device and process in MATLAB, where we generated a waterfall plot of the data.
}}}
'''Update: Raw IQ Samples and Processing in MATLAB'''
Next, using the same frequencies and sampling rate as the original tutorial, we modified the OEDL script in order to collect raw time domain samples using ORBIT as opposed to samples that had already been converted into the frequency domain.
[[BR]][[BR]]
We then wrote a MATLAB script entitled "spectro" which we used to convert the raw data into the frequency domain. From there, we again generate a waterfall plot of the data.
[[BR]][[BR]]
Using the raw IQ samples instead of preprocessed FFT data allows for more flexibility in our signal processing. We now have access to a much larger collection of data, and we can produce more accurate frequency domain transforms.
----------
==== Experiment 2: Signal Transmission and Processing with Two Transmitters and One Receiver ====
In this experiment, we write an OEDL script that uses two transmitters and one receiver to collect preprocessed FFT samples. Utilizing three USRP2 radios on the grid, two nodes were used as transmitters, and one as a receiver.
[[BR]][[BR]]
The first transmitter starts at a frequency of 798 MHz and increases to 802 MHz, while the second transmitter starts at a frequency of 804 Mhz and increases to 808 MHz all over a span of 2.5 seconds. The receiver has a carrier frequency of 803 MHz and a bandwidth of 12 Mhz.
[[BR]][[BR]]
We then save the FFT data from the receiver to our local device and process in MATLAB, where we generated a waterfall plot of the data.