| Version 36 (modified by , 19 months ago) ( diff ) |
|---|
Enabling Spectrum Coexistence of 5G mmWave and Passive Weather Sensing
WINLAB Summer Internship 2024
Advisors: Narayan Mandayam, Ivan Seskar
Graduates: Hariharan Venkat
Group Members: Despoina Kosmopoulou, John Allen Manego, Mark Moroney, Prakshab Adhikari, Archisa Arora
Project Objective
The 5G data frequency is close to the weather band, which can result in spectral leakage affecting weather satellites and affecting weather prediction patterns. Our task is to develop an experimental pipeline to measure spectral leakage on weather satellites. We will use Phased Array Antenna Modules (PAAMs) to mimic the 5G satellite and a spectrum analyzer to mimic the weather satellite.
Week 1
Summary
- Read Papers on PAAMs, 5G data leakage onto satellites
- Getting Familiar with devices such as PAAMs and Spectrum Analyzer
Week 2
Summary
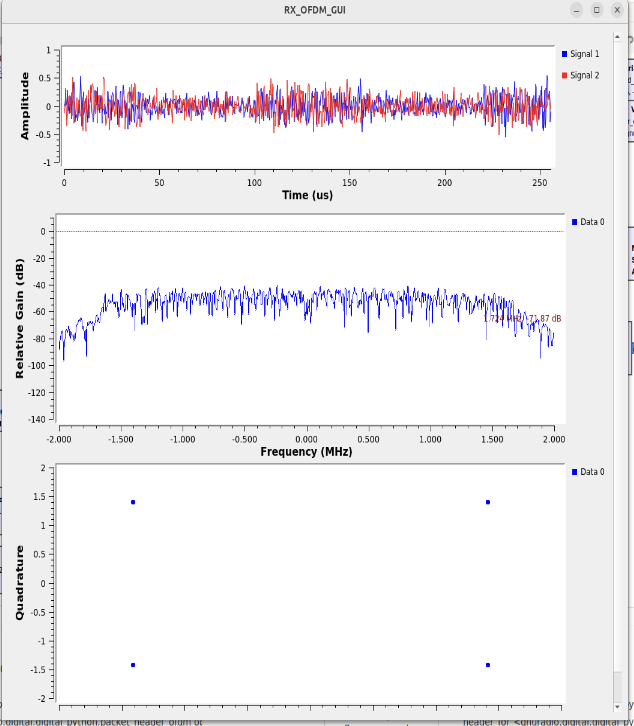
- Followed GNURadio OFDM Tutorial on Orbit Sandbox 1 and Sandbox 2
Week 3
Summary
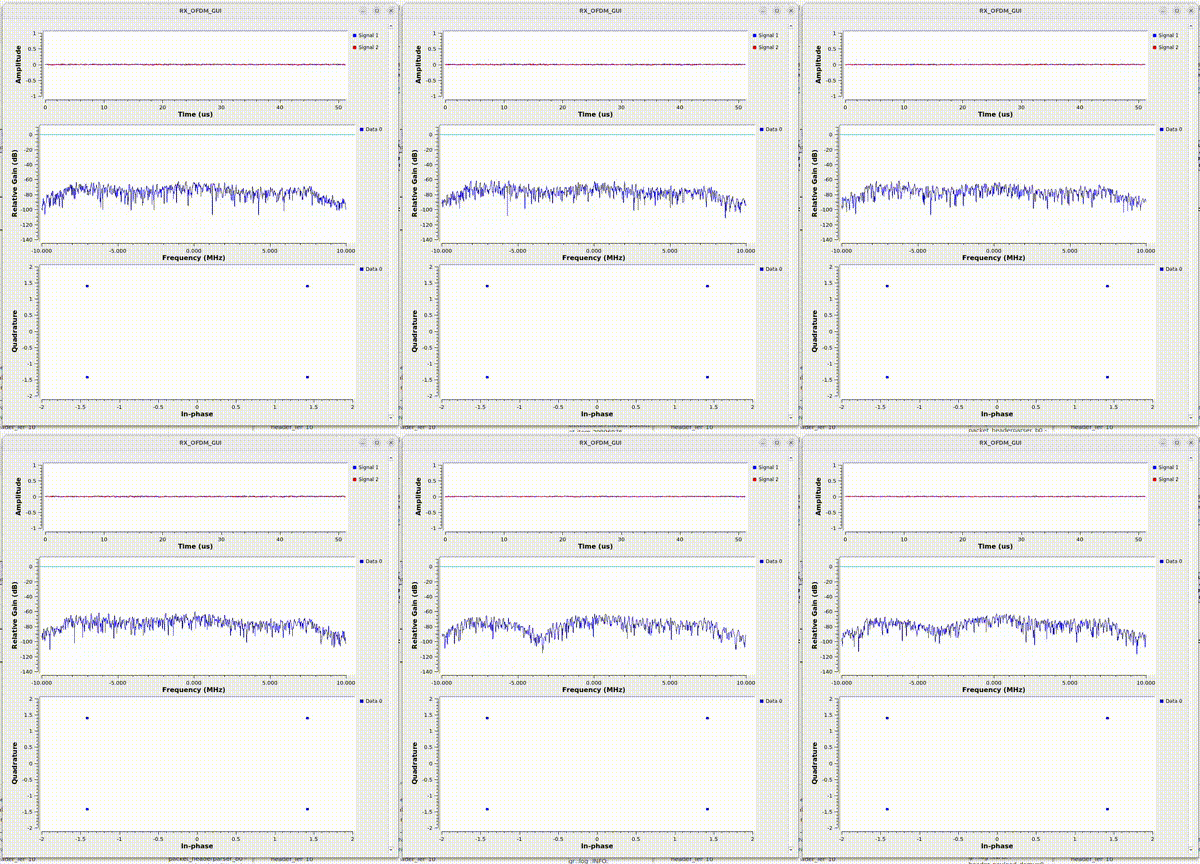
- Used the sb1 PAAMs to transmit orthogonal frequency-division multiplexing (OFDM)signal to transmit our signal
- Getting familiar with GNURadio and Sandbox 1(Cosmos)
Week 4
Summary
- Measured the Oscillator error and the noise floor for practice
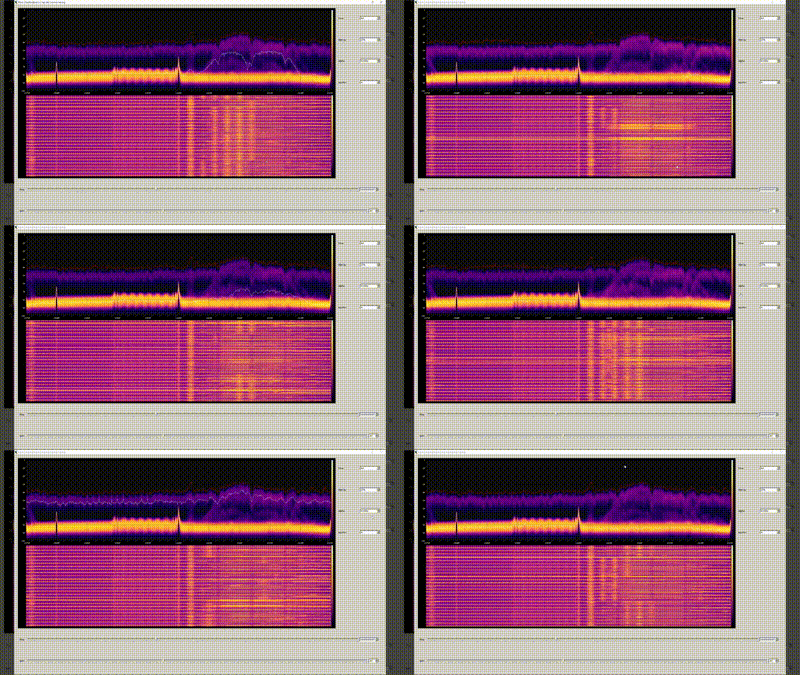
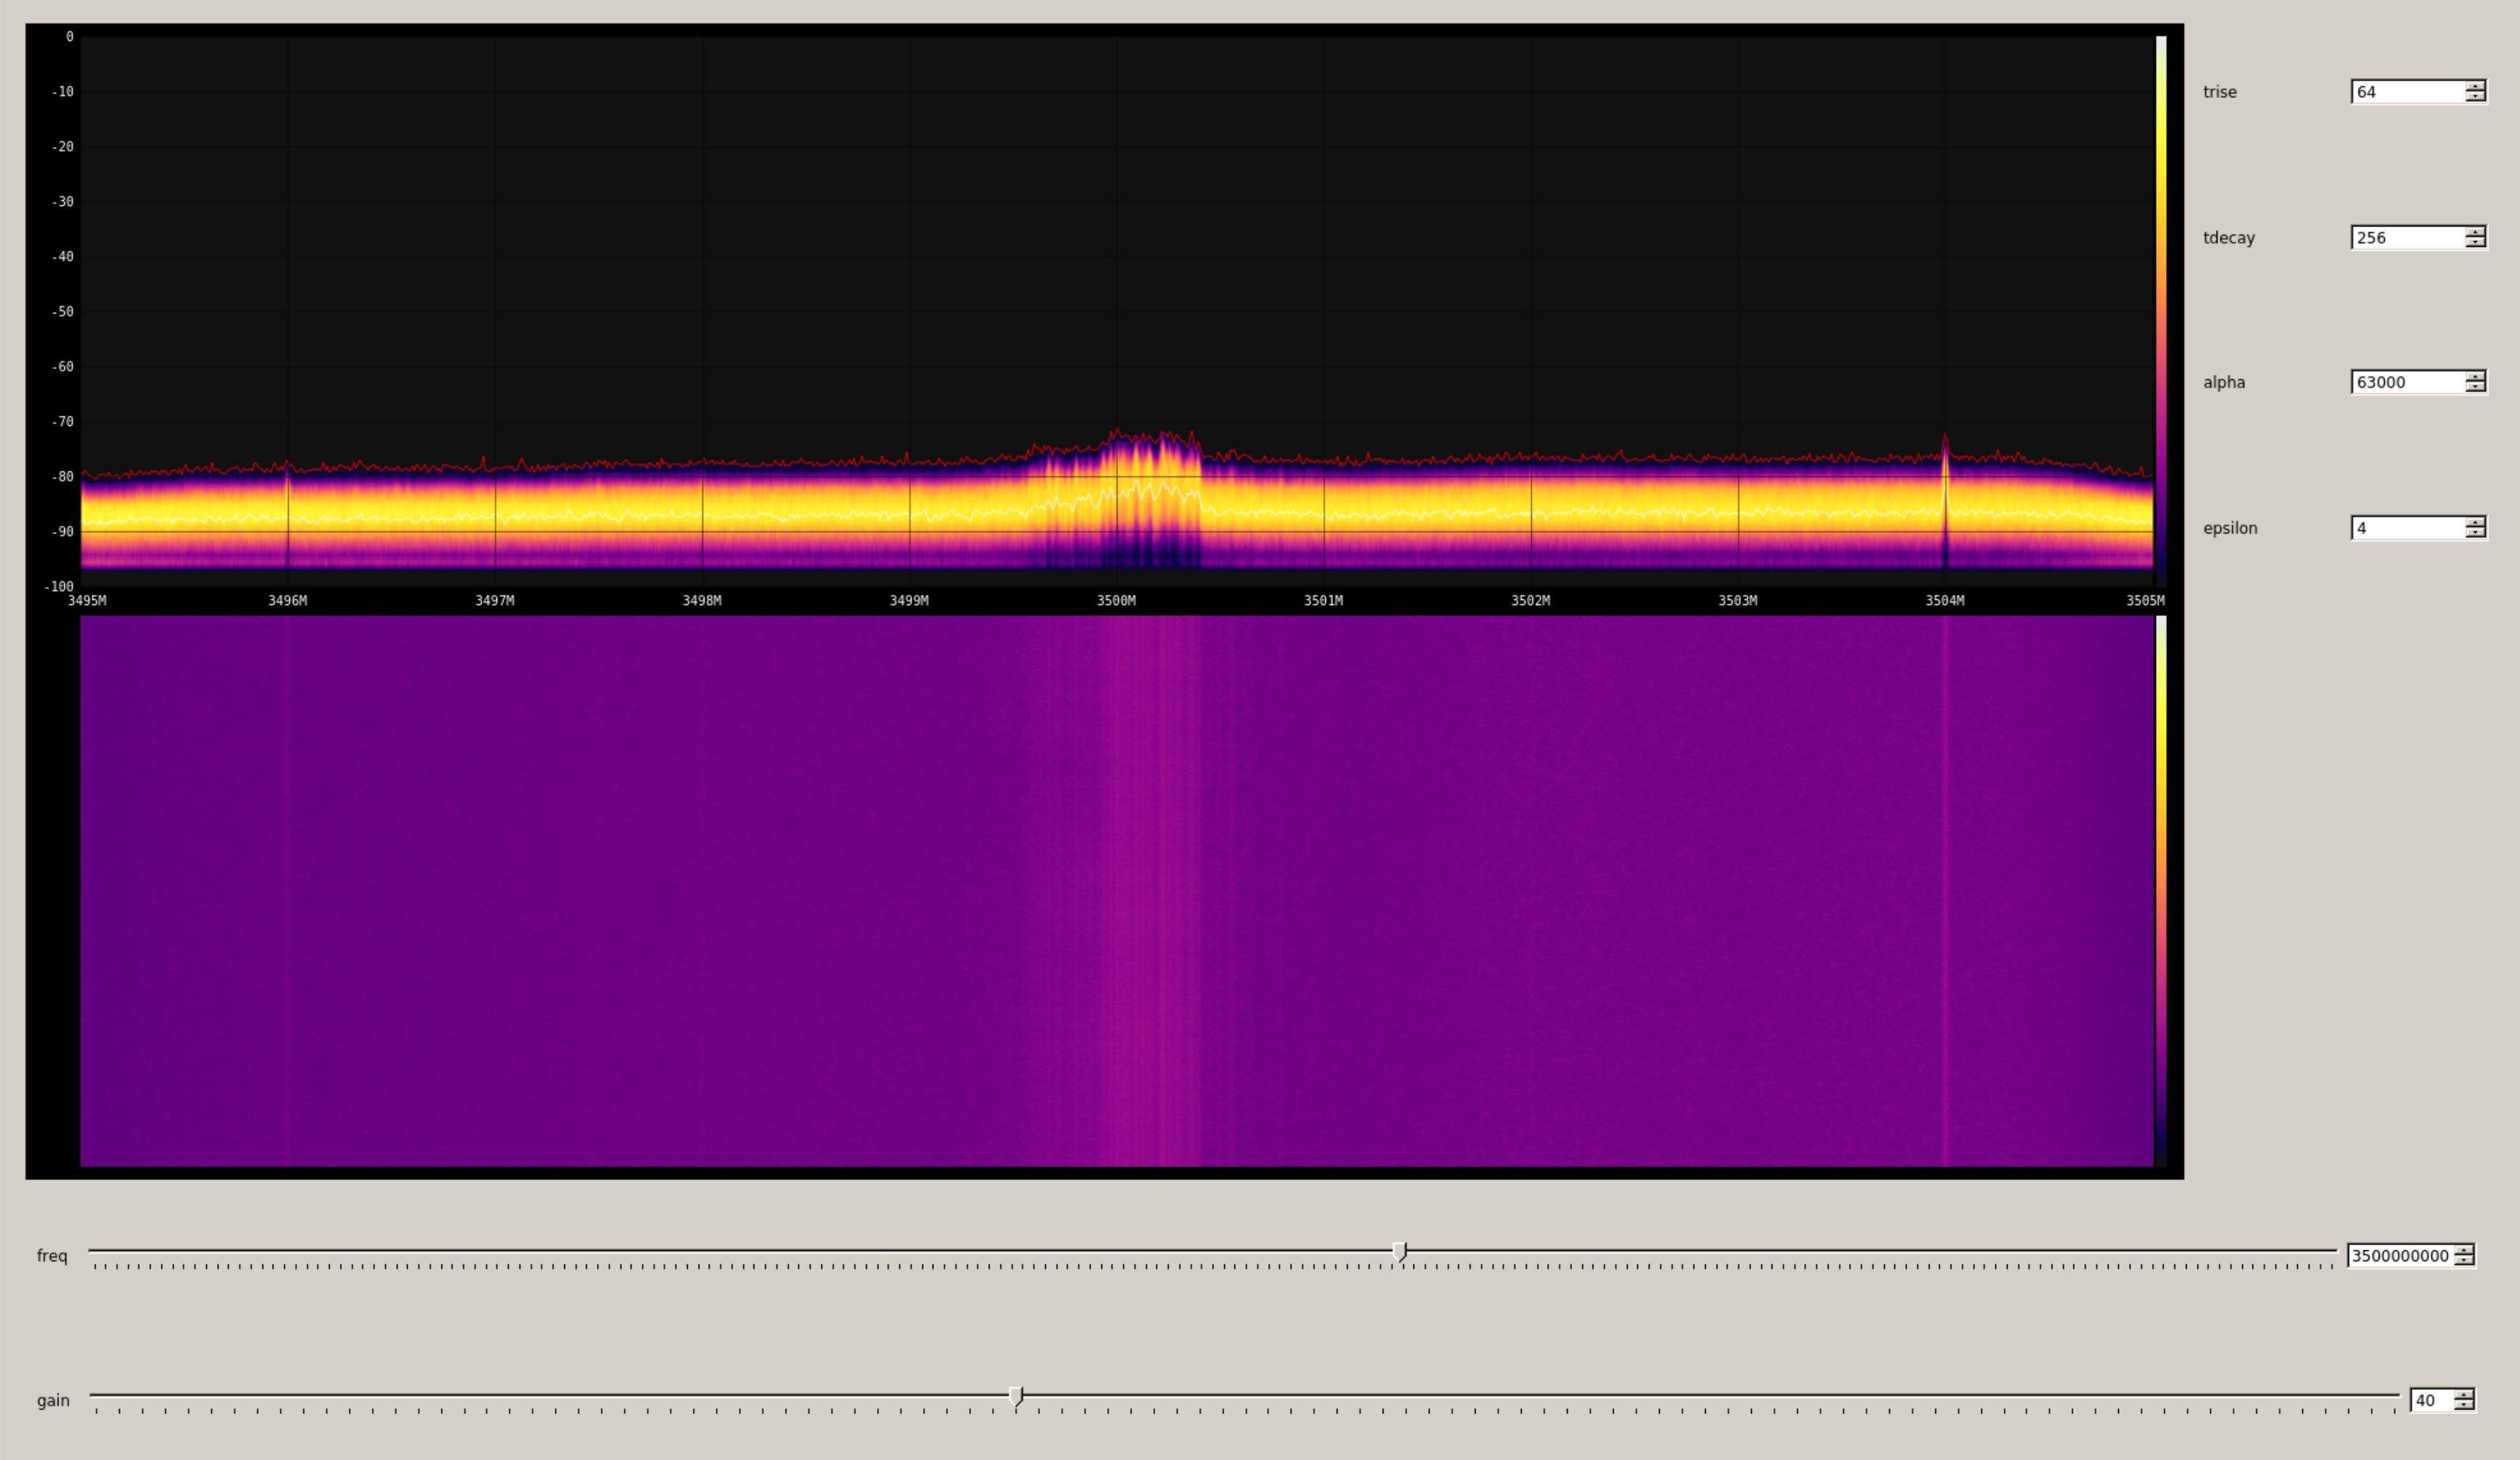
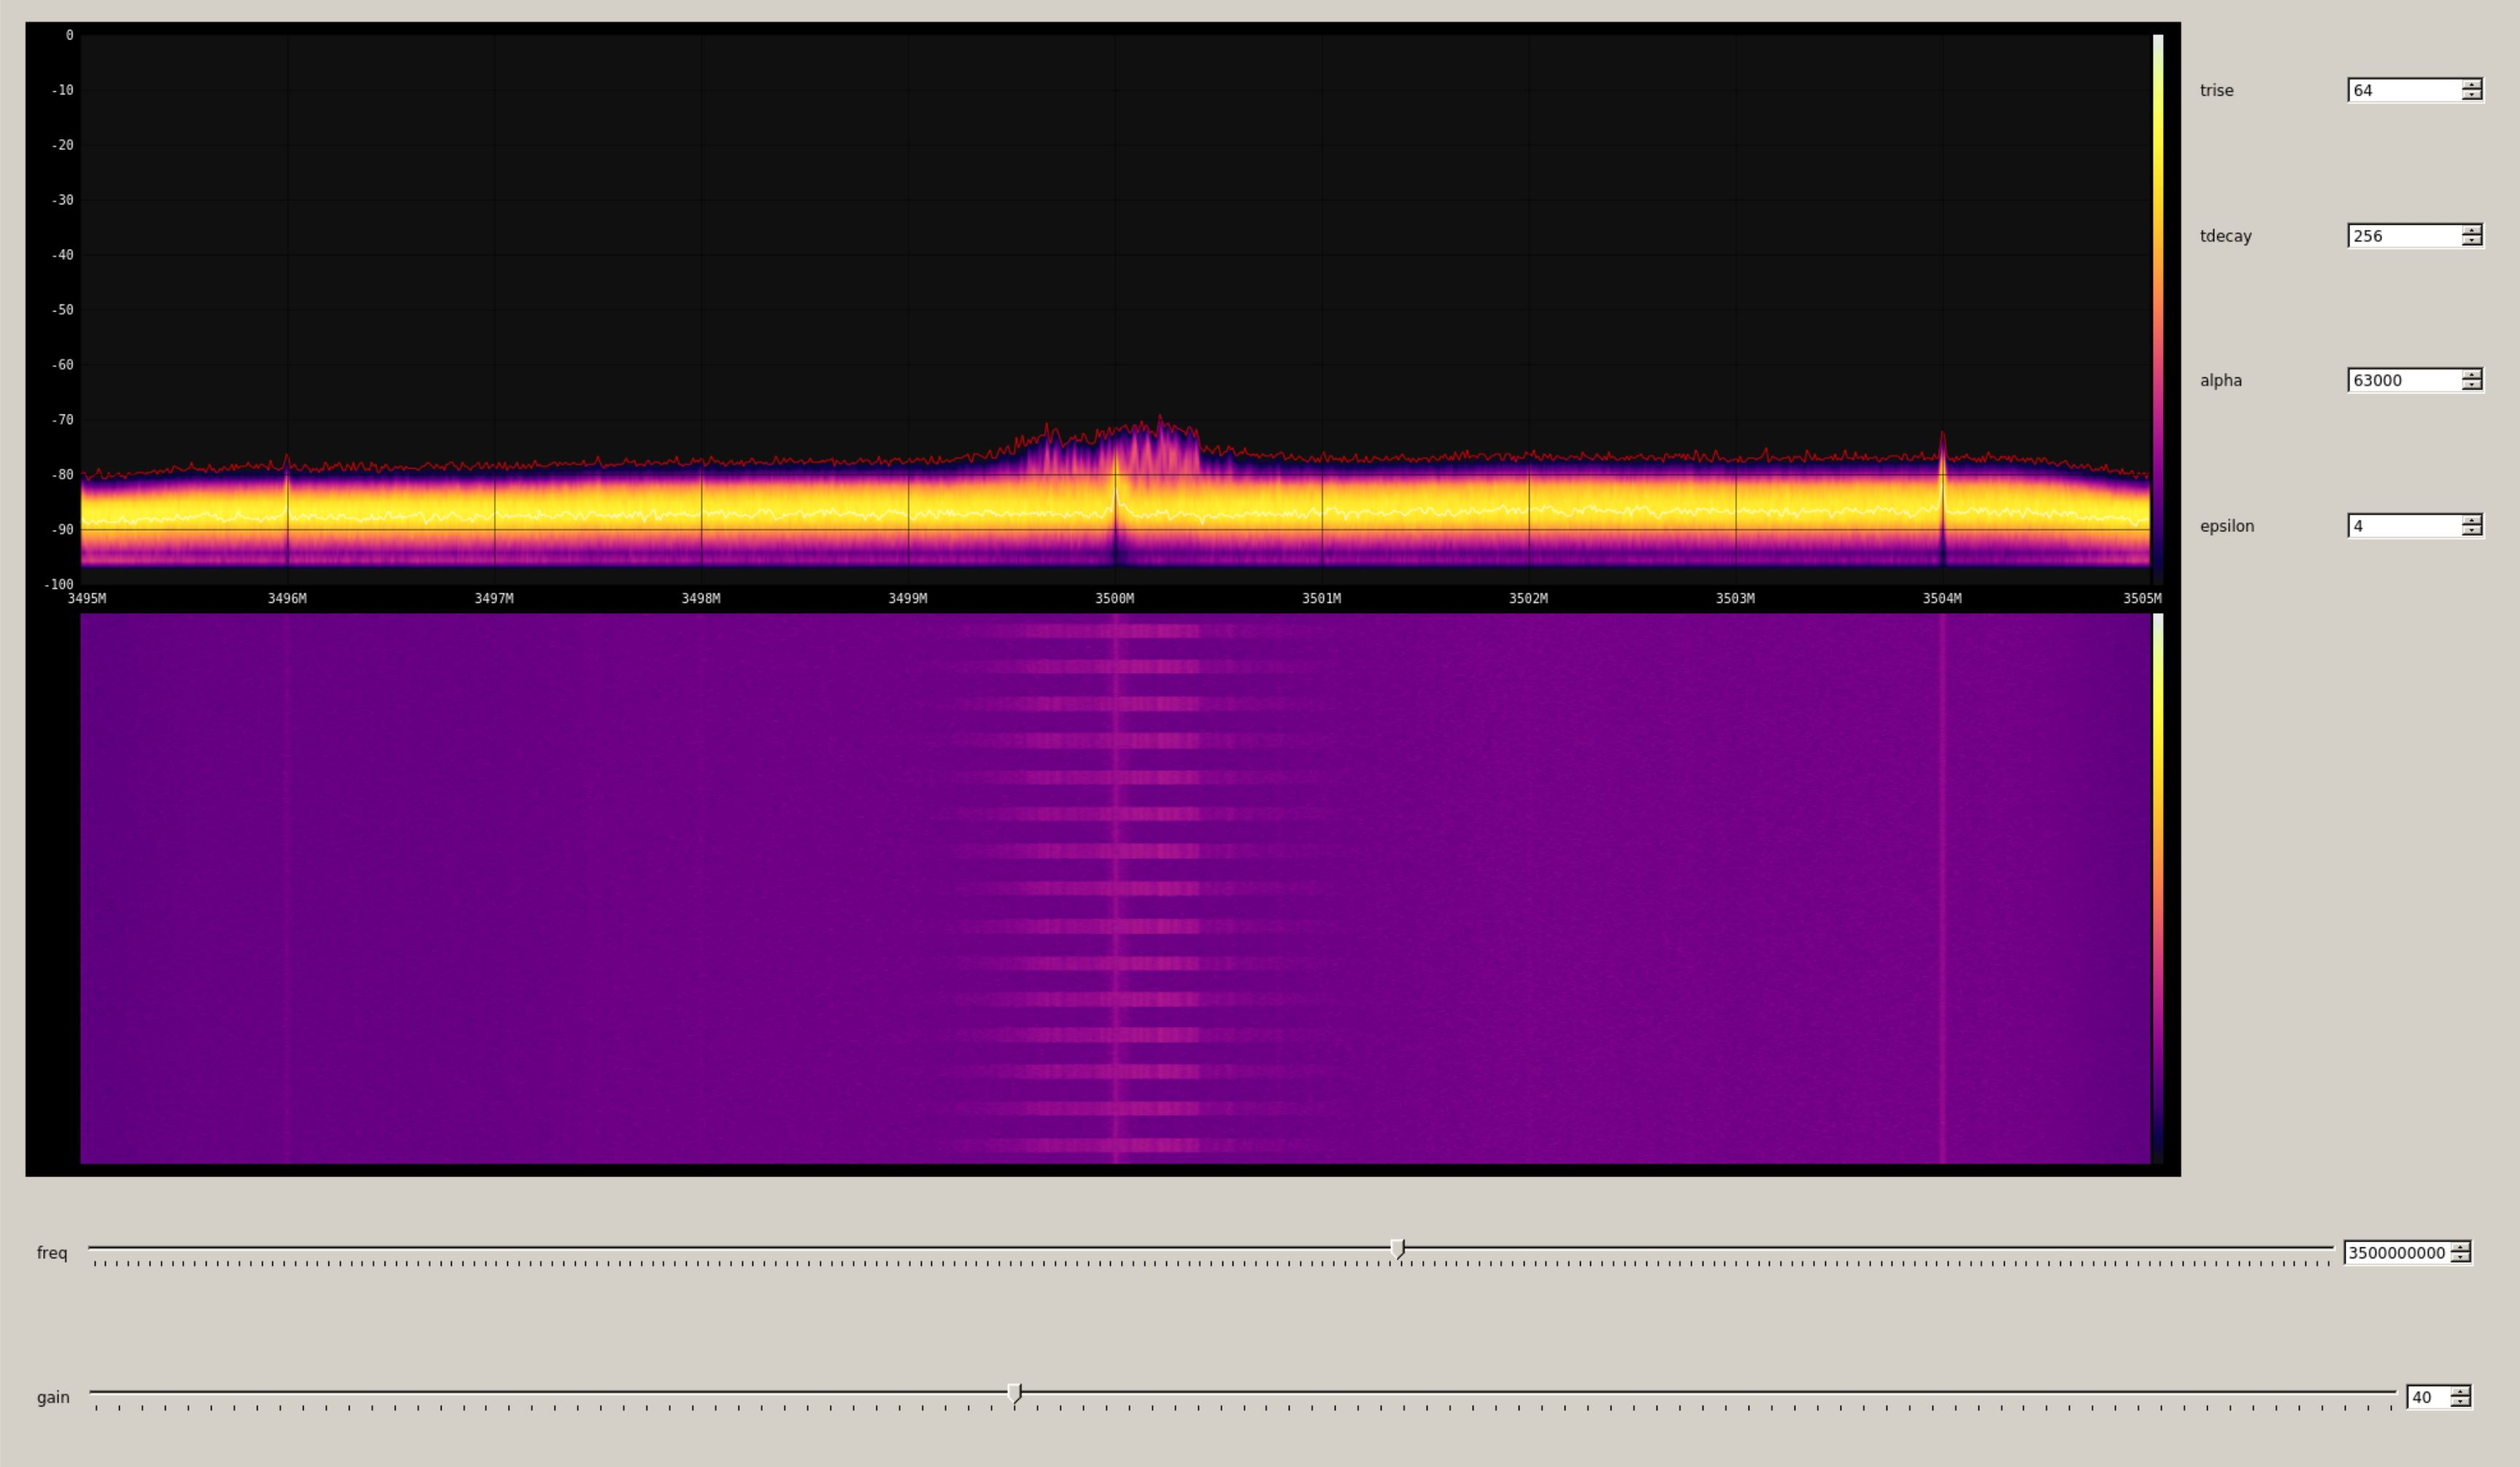
- Followed the Spectrum visualization with Fosphor tutorial
- Able to see the wifi in Winlab (big purple area)
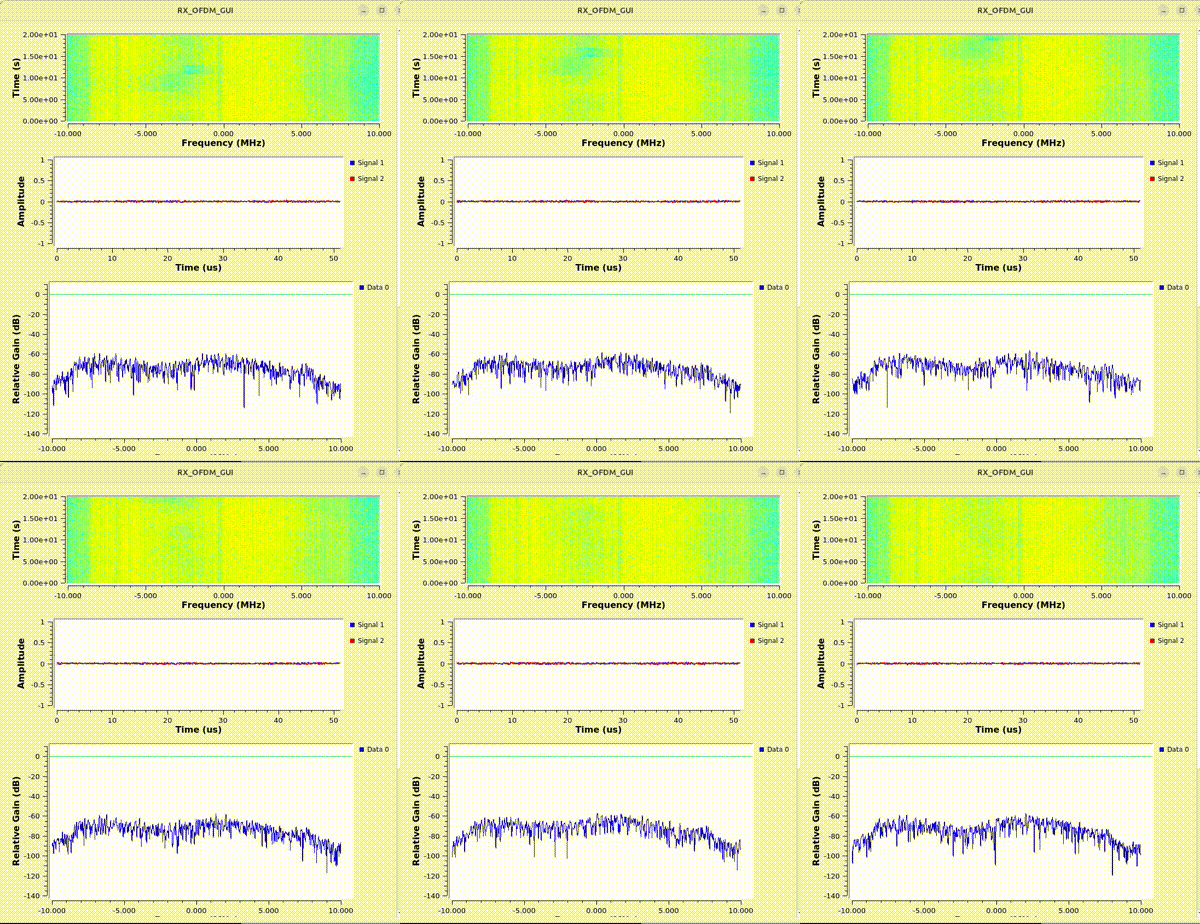
- Create a waterfall diagram with the OFDM signal tutorial
Week 5
Summary
- Practiced Transmitting a OFDM Signal
- Worked on using Foshphor with the different group
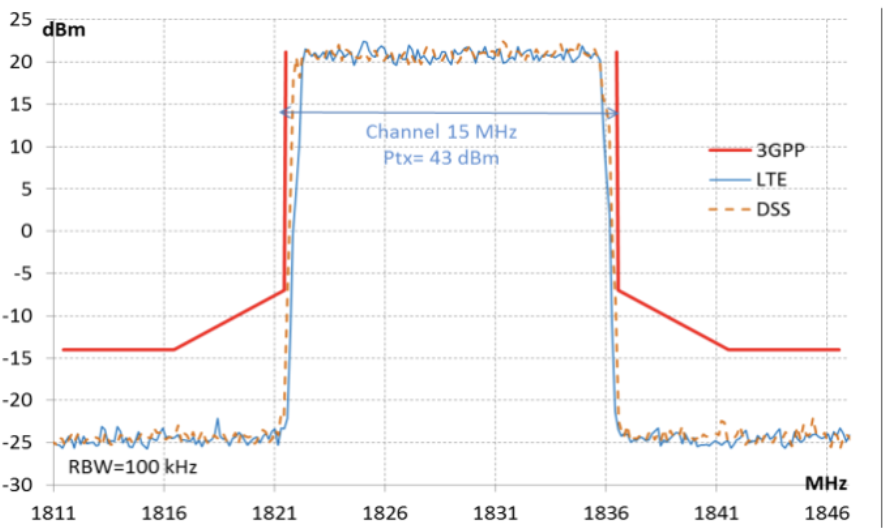
- Found the Spectrum Mask on the FR2 Band
Week 6
Summary
- Practiced Transmitting a OFDM Signal
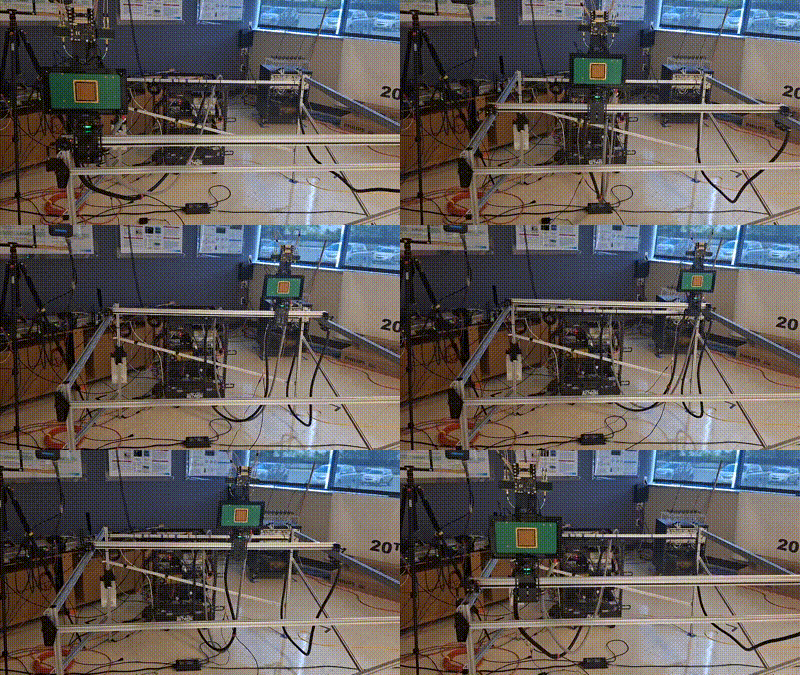
- Started Testing the x,y movement controls of the PAAM device
- Worked on the θ Theta and φ Fi directional beam forming with the PAAM device
- Set up and used the spectrum analyzer to listen to the PAAM conversation
Week 7
Summary
- Created a Ruby code to get raw data from a graph and send it onto an Excel sheet
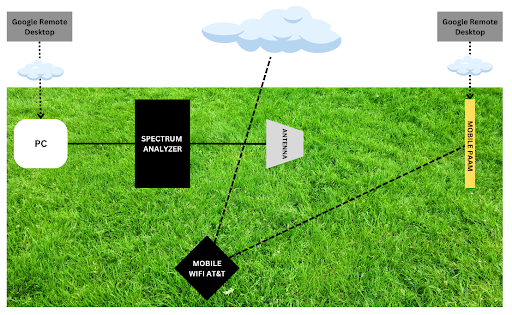
- Set up our station outside to mimic 5G transmission and weather satellites
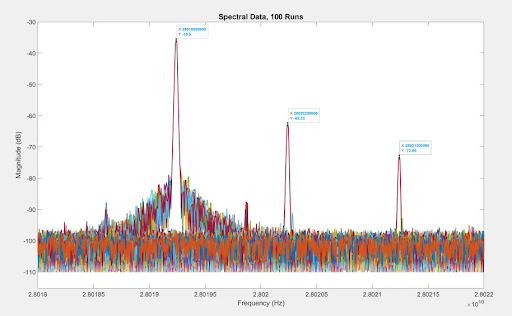
- Transmitted a simple sine wave and measured the relative power of the signal using spectrum analyzer
- Used matlab to create a 2D and 3D graph of the data we received from the Spectrum Analyzer
Attachments (15)
-
OFDM image.png
(119.8 KB
) - added by 20 months ago.
OFDM week 2
- week 3 image OFDM Signal.gif (453.5 KB ) - added by 20 months ago.
- waterfall week 4.gif (3.6 MB ) - added by 20 months ago.
- wifi week 4.gif (1.6 MB ) - added by 20 months ago.
- fosphorProg2.png (2.4 MB ) - added by 20 months ago.
- fosphorProgress1.png (2.3 MB ) - added by 20 months ago.
- fr2maskgraph.png (204.7 KB ) - added by 20 months ago.
- PAAMMoving.gif (5.4 MB ) - added by 20 months ago.
- week7Setup.png (262.1 KB ) - added by 19 months ago.
- week7Graph.png (79.6 KB ) - added by 19 months ago.
- visualization4outsideexperiements.jpg (811.2 KB ) - added by 19 months ago.
- rxspectrumgraph week 8.png (43.8 KB ) - added by 19 months ago.
- gnuradio week 9 actually.png (237.8 KB ) - added by 19 months ago.
- week9 converting binary to legible.png (1.6 MB ) - added by 19 months ago.
-
classification_example.ipynb
(1.2 MB
) - added by 19 months ago.
This is a jupyter notebook that contains a simple pipeline of ML processing for the data we extracted. The processing is by no means perfect, nor we expected it to be - it is a proof of concept.

