
| Version 39 (modified by , 11 months ago) ( diff ) |
|---|
Cloud-native O-RAN
WINLAB Summer Internship 2025
Interns: Sree Harshitha Jonnalagadda, Dominic Catena, Dhruv Ramaswamy
Advisors: Ivan Seskar, Tracy Van Brakle
Project Overview
We are part of the Cloud-native O-RAN team, actively collaborating with the O-RAN Testing Curriculum Development team, to advance the understanding and adoption of Open-RAN technologies.
As part of this collaboration, we are working on developing a course on Open RAN, hosted on our website Praxeum, in order to help fellow students acquire the knowledge needed to help accelerate the widespread adoption of Open, Programmable, Secure 5G.
In parallel, we Cloud-native team are working on the Hybrid-M plane testing project, which focuses on validating the interface between the O-RU framework and the SMO (Service Management and Orchestration) platform via the O-RU Controller. This project involves executing and analyzing standardized test cases (e.g., NETCONF session establishment, configuration data exposure, and management session verification), ensuring reliable and compliant M-Plane behavior in line with O-RAN specifications. We are also contributing to the development of new Graphical User Interfaces (GUIs) and custom test cases to extend the testing framework further.
Alongside, we are working with O-RAN Testing Curriculum Development team on designing/creating rApps for various O-RAN use cases.
Weekly Progress
Week 1
- Read the O-RAN Alliance documentation provided by our advisor.
Week 2
- Read the O-RU_ACCoRD_CloudBased provided by our advisor.
Week 3
- Read the presentation https://www.orbit-lab.org/attachment/wiki/Other/Summer/2025/Cloud-Native-O-RAN/hybrid_mplane_testing_framework.pdf provided by Alexandru Stancu, an O-RAN expert.
- Studied and researched more about O-RAN Deployment Models.
- Worked on Hybrid M-plane Testing Framework Architecture.


Week 4
- We referred to the github repositories:
- https://github.com/o-ran-sc/it-tifg
- https://github.com/o-ran-sc/oam/tree/master/solution
These were mentioned by Alex.
- After studying the README files of the repositories, we understood that we need to set up two frameworks:
- Service Management and Orchestration (SMO) for Operations and Maintenance (OAM) and O-RU framework to test the Hybrid M-plane.
- Prerequisites:
The solution was tested on a virtual machine (VM in grid (ORBIT) or sb9 (ORBIT) nodes from make a reservation) with the following configuration:- 4 CPU cores
- 16 GB RAM
- 50 GB storage
- Python 3.12 (default in Ubuntu 24.04)
- Docker installed
- Firstly, we started by setting up the SMO for OAM framework and performed a step-by-step environment setup:
- Created .env files
- Configured domain settings
- Built docker compose infrastructure
- Simulated various network services (e.g., controller, VES collector)
- Debugged and resolved common setup issues such as:
- health checks
- certificate installation (Opendaylight)
- DNS/host issues
- The Opendaylight controller requires a certificate to be installed before it can be launched. It is installed via https://docs.opendaylight.org/en/latest/downloads.html
OpenDaylight:
Opendaylight (ODL) is an open-source, modular, and extensible Software-Defined Networking (SDN) platform designed to enable centralized network control and programmability. In the context of the O-RU and SMO frameworks for testing the Hybrid Management Plane (Hybrid M-plane) in O-RAN architecture, Opendaylight acts as the SDN controller responsible for managing and orchestrating network services, configurations, and state synchronization between components.
Within the SMO (Service Management and Orchestration) framework, Opendaylight plays a critical role in:
- Controlling and automating the configuration of the O-RU (O-RAN Radio Unit) over standardized interfaces (e.g., NETCONF/YANG).
- Simulating or managing the communication across the O-RAN M-plane, which blends traditional and virtualized infrastructure.
- Ensuring secure and policy-driven operations, such as certificate handling, device onboarding, and performance monitoring.
Its extensibility and compatibility with O-RAN-defined models make Opendaylight a foundational component for building a reference implementation that reflects the goals of a disaggregated, interoperable RAN.
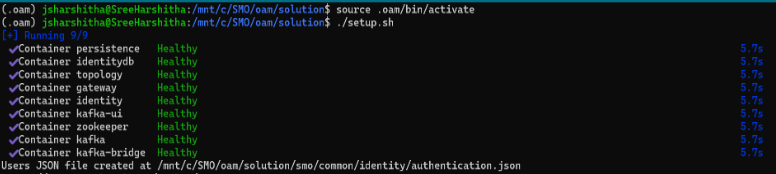
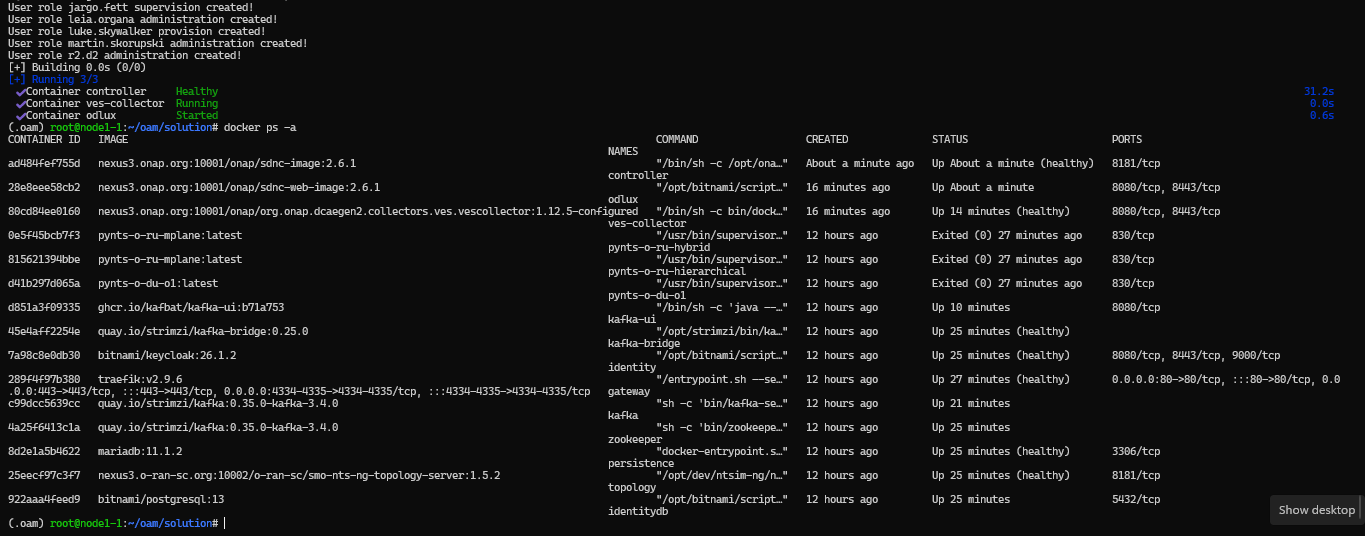
Docker Containers Setup:
- By following the commands in the repository of SMO for OAM, we ran command for setting-up the docker containers.


Week 5
- Completed the setup of SMO framework by running all the containers (healthy).
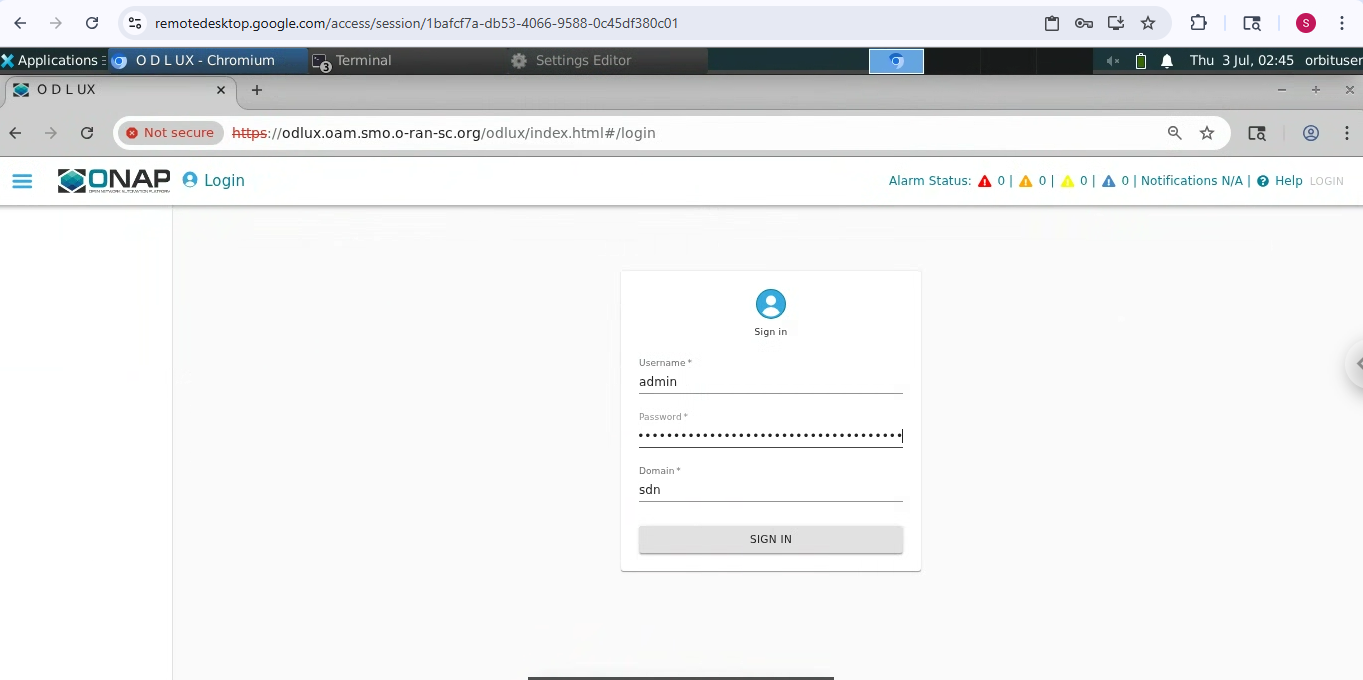
- The SMO framework is having a GUI named ODLUX (Opendaylight User Experience). We are able to access the web interface https://odlux.oam.smo.o-ran-sc.org/ and are working on login access.

ODLUX (Opendaylight User Experience):
- A web-based graphical user interface (GUI) built on top of Opendaylight (ODL) SDN controller.
- Designed to act as the front-end interface for managing and visualizing network configurations, topologies, and operational data.
- Utilized in O-RAN SMO frameworks and ONAP platforms as a lightweight Network Management System (NMS) interface.
- Facilitates interaction with underlying YANG-modeled network services via RESTCONF or NETCONF APIs.
- Commonly used for functions like device onboarding, network inventory, operational status monitoring, and managing O-RU configurations in Hybrid M-plane setups.
Week 6
ODLUX GUI Activation and Login Fixes:
- Fixed minor issues in the docker-compose.yaml and ODLUX configuration files.
- Ensured that the controller container (typically Opendaylight-based SDN-R) starts correctly and is healthy, allowing ODLUX to connect via the northbound RESTCONF interface.
- Verified proper controller endpoint mappings in the SMO solution (inside smo/oam/docker-compose.yaml) to expose port 8181 required by ODLUX.
- Checked health checks and logs to resolve service failures (e.g., replacing broken containers, restarting Docker services).
- Set up network services (like ves-collector) to support back-end event monitoring used in the ODLUX dashboard.
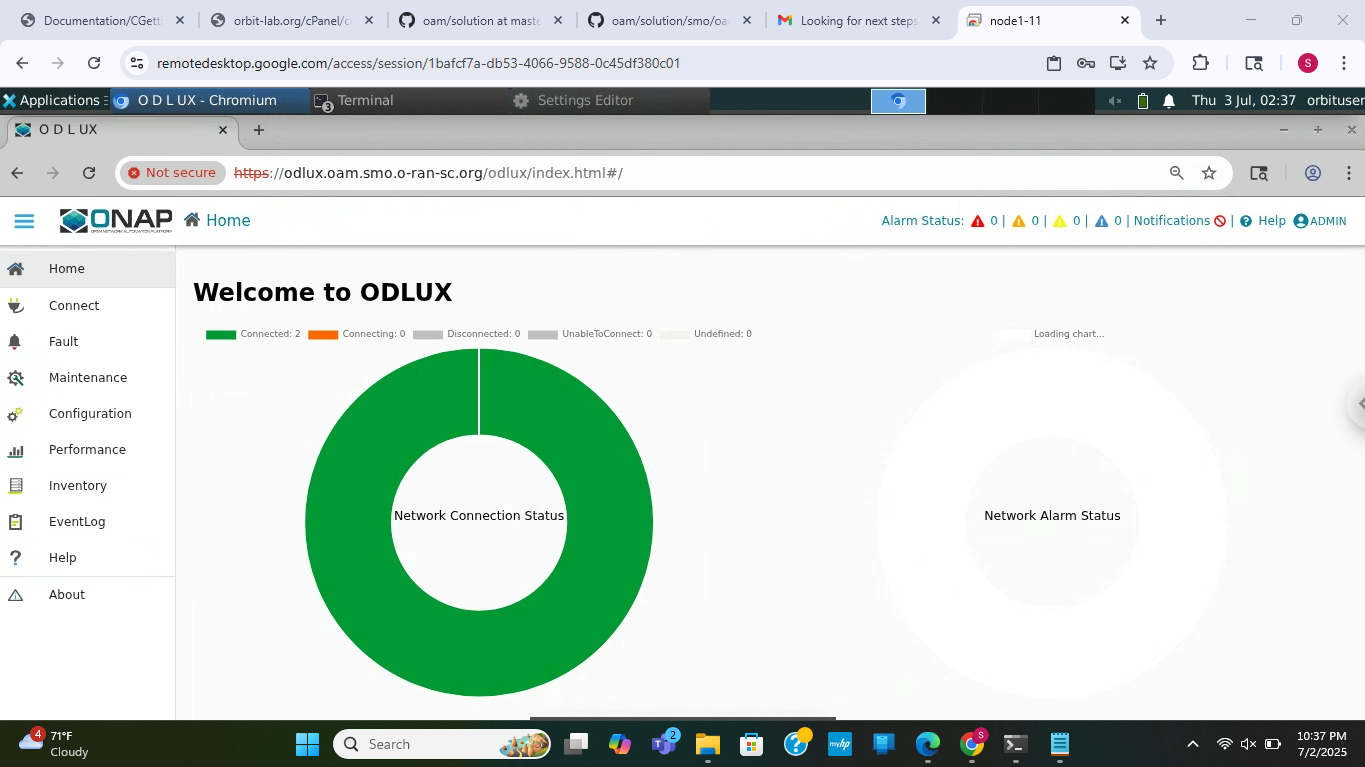
- After resolving the above issues, we were successfully able to access the ODLUX landing page.
- Landing page of ODLUX GUI:

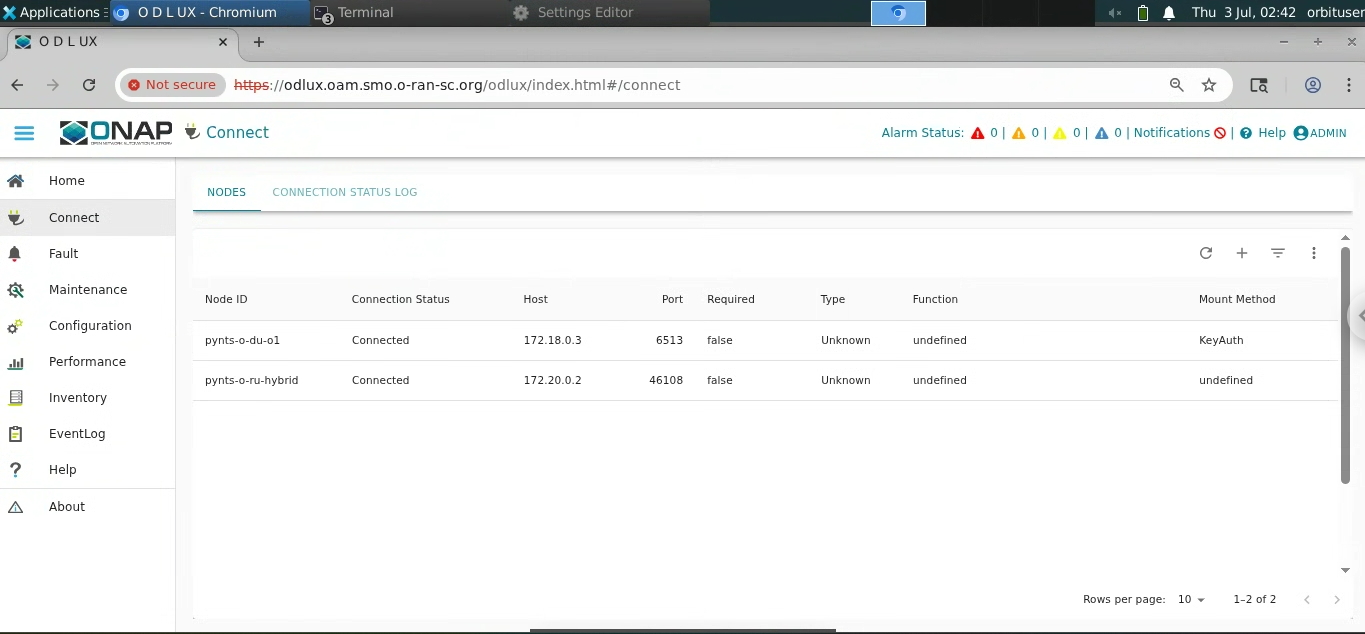
- ODLUX Interface Showing Connected Network Nodes in SMO Framework

- This image displays the ODLUX (Opendaylight User Experience) web GUI from the SMO (Service Management and Orchestration) framework, accessed via the ONAP-integrated dashboard.
- It shows the current connection status of two network nodes—pynts-o-du-o1 and pynts-o-ru-hybrid—which represent simulated or virtualized components of the O-RAN Distributed Unit (O-DU) and Radio Unit (O-RU), respectively.
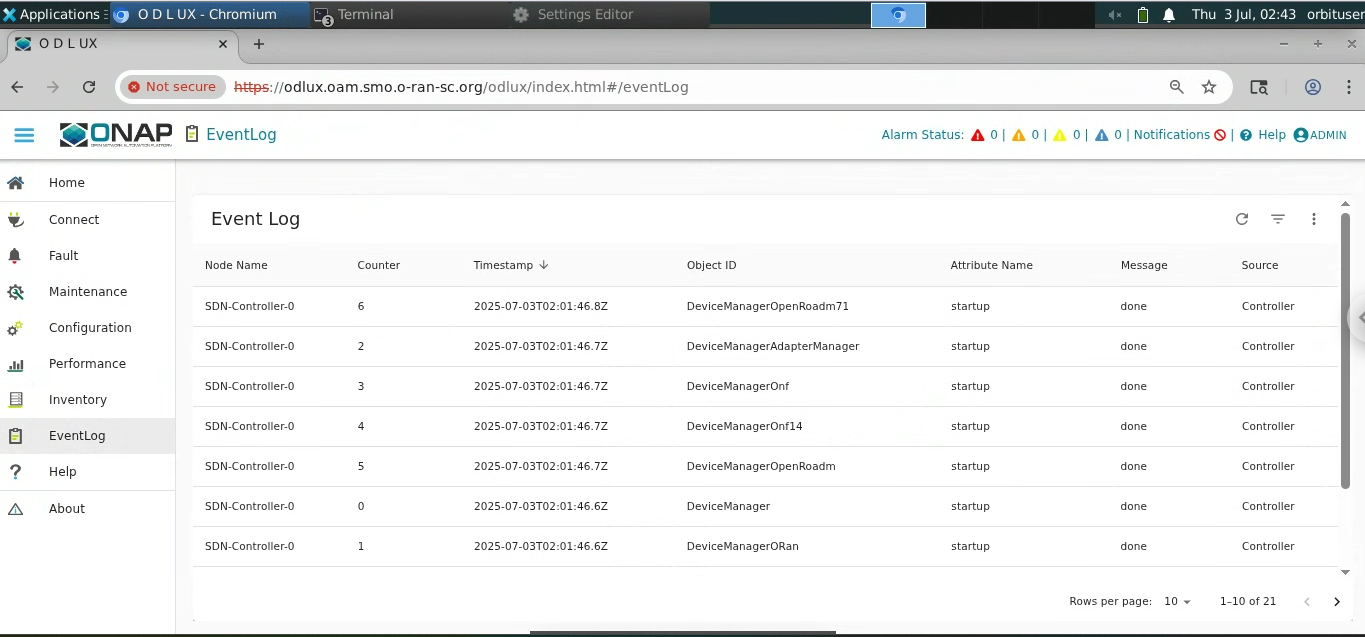
- Eventlog View in ODLUX – SDN Controller Startup Status

- The image shows the Eventlog section of the ODLUX (Opendaylight User Experience) GUI within the SMO (Service Management and Orchestration) framework.
- This log provides real-time insight into system-level and controller-level operations.
- Each row in the table represents a startup event of a component managed by the SDN-Controller-0, the central Opendaylight instance in the SMO architecture.
Key columns in the Eventlog:
- Node Name: Identifies the source node generating the log entry. Here, all events originate from SDN-Controller-0.
- Counter: Indicates the occurrence count of each specific log entry.
- Timestamp: Records the exact time the event occurred, using ISO 8601 format (e.g., 2025-07-03T02:01:46.8Z).
- Object ID: Names the logical components involved in the event, such as:
- Device Manager Open-Roadm-71
- Device Manager Adapter Manager
- Device Manager Onf
- Device Manager O-Ran
These typically represent device manager modules or plugins supporting specific YANG models or protocols (e.g., Open-ROADM, ONF, O-RAN).
- Attribute Name: Denotes the operation being reported. In this view, all entries relate to the startup sequence.
- Message: Indicates the status of the operation; all are marked as done, meaning successful initialization.
- Source: Identifies the subsystem responsible for generating the event (Controller in this case).
This log confirms the successful initialization and registration of core device manager services within the SDN controller, which are crucial for interfacing with RAN elements in a Hybrid M-plane setup.
Week 7
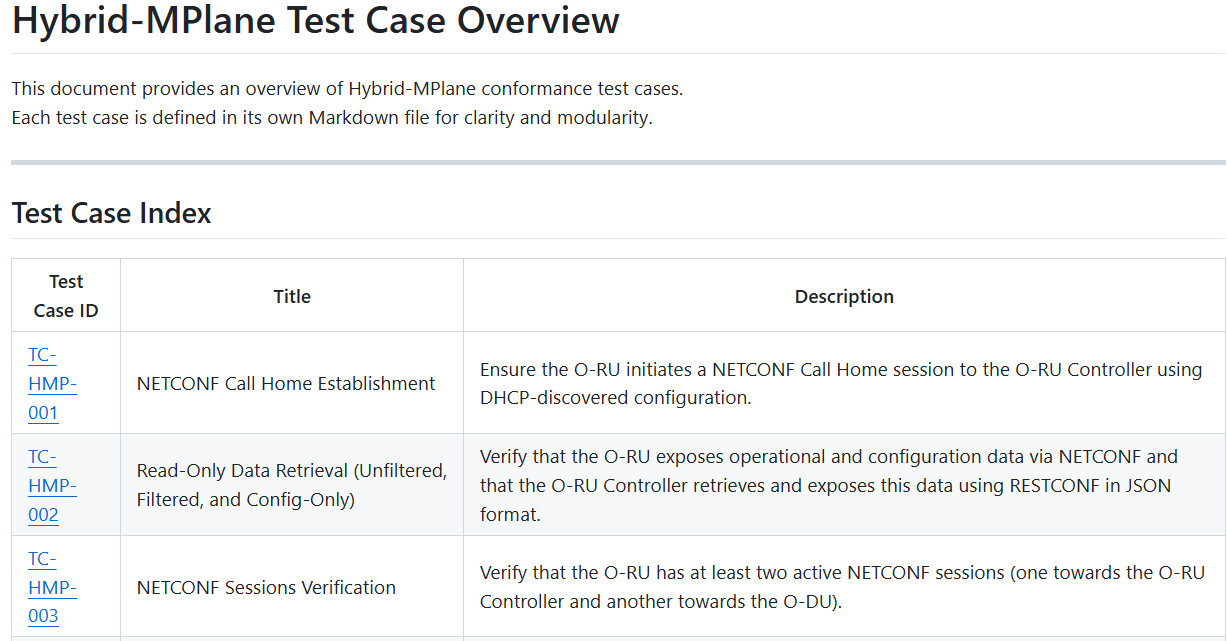
- We have successfully implemented setting up the SMO for OAM framework and O-RU framework.
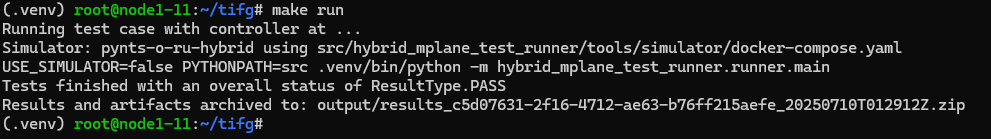
- Now, we are working on running test cases. We implemented "make run" command, where there is a makefile with the shell scripting in it based on our 3 test cases and each test case has its own python code for it and we implemented the three test cases by running single command "make run".

- We actually implemented the "make run" only for Test case-002 and Test case-003, as the Test case-001 is completely real-time based application. We got result as "PASS" for Test cases-002,003.
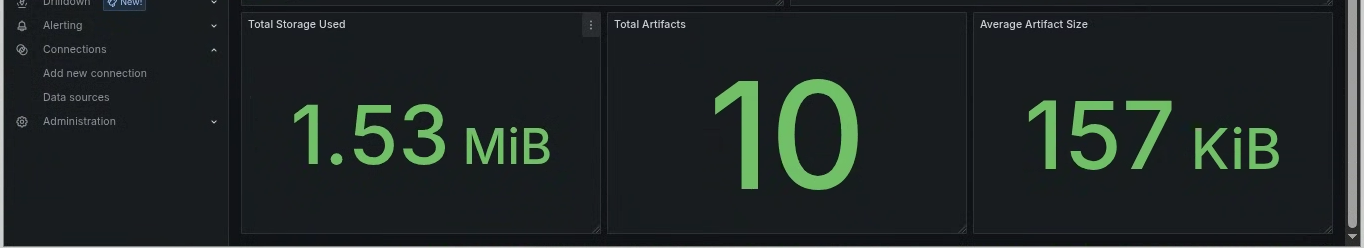
- In the O-RU framework, there is Grafana (for visualizing, analyzing, and interpreting test results and system metrics) and MinIO console (which is relevant to S3 in AWS).

Grafana Dashboards
- Grafana is integrated into the testing framework to provide real-time observability into the performance and results of O-RU and SMO interactions, specifically during the execution of Hybrid M-Plane test cases.
- The key functions of Grafana in this project are:
- Visualizing test execution data collected during the running of TC-HMP-002 and TC-HMP-003.
- Providing clear insights into NETCONF session status, configuration data flow, and interface behavior.
- Helping developers and testers verify protocol compliance, troubleshoot issues, and validate expected results.
- Supporting long-term analysis and historical tracking of test case results.
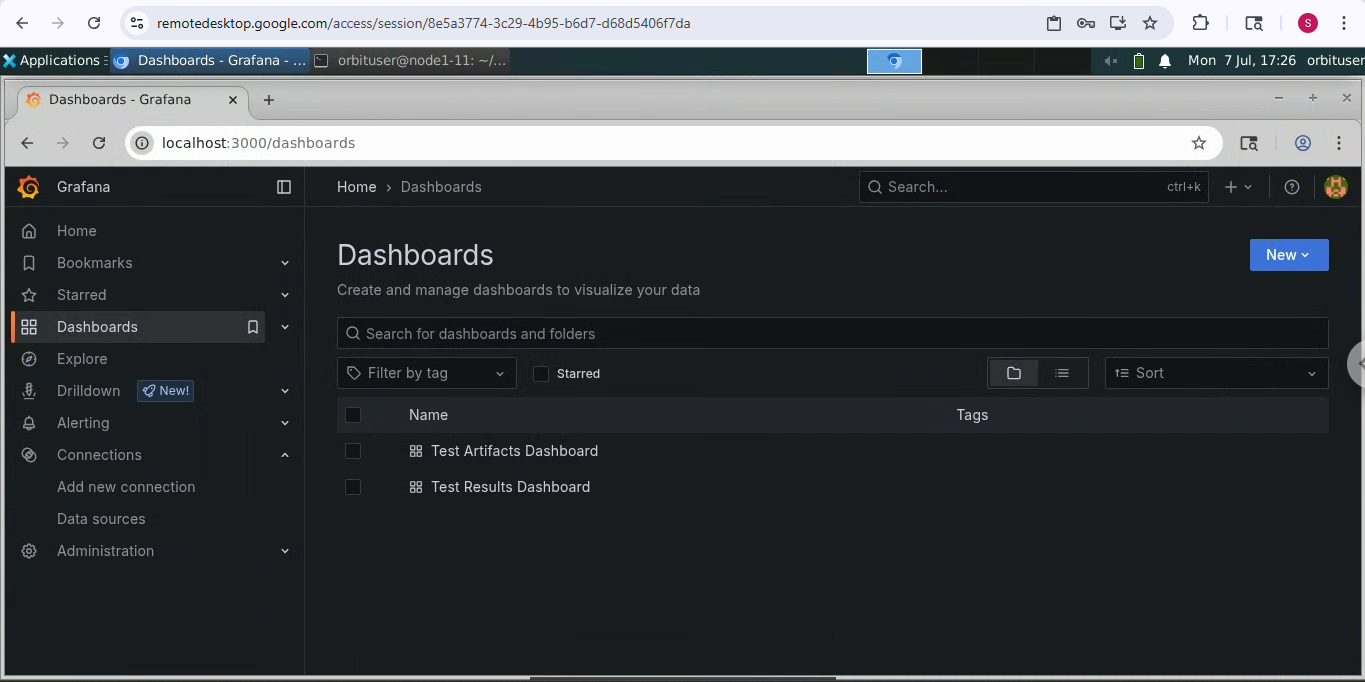
- The framework offers pre-configured dashboards, accessible via Grafana web interface (http://localhost:3000), after starting the visualization stack using docker compose.
- The two most relevant dashboards are:
- Test Artifacts Dashboard
- Test Results Dashboard
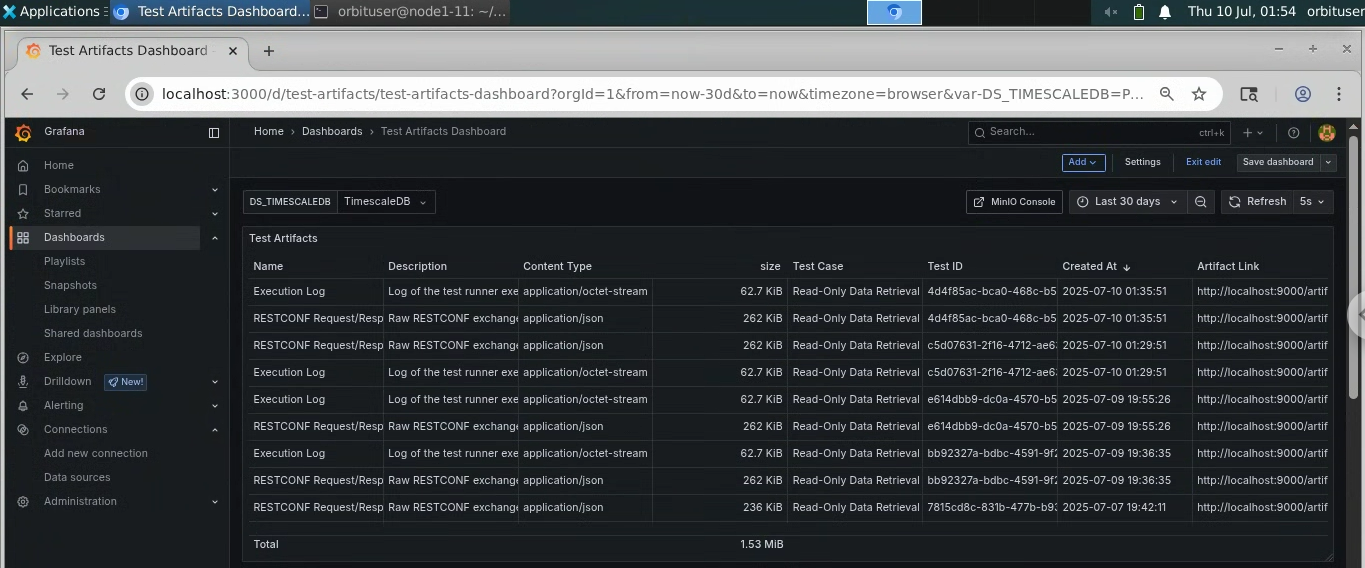
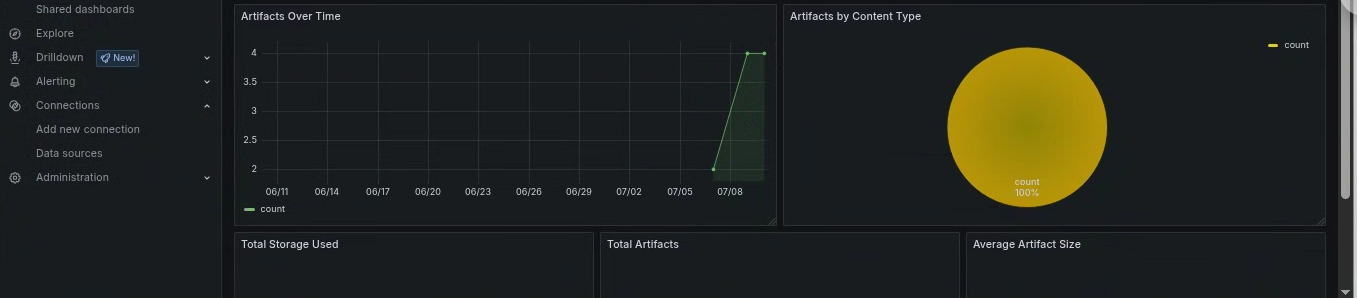
- Test Artifacts Dashboard:
- Displays detailed metrics and logs related to individual test cases.
- Allows viewing test IDs, execution timestamps, pass/fail status, and error messages.
- Enables deep-dive analysis into specific test artifacts and debug traces.
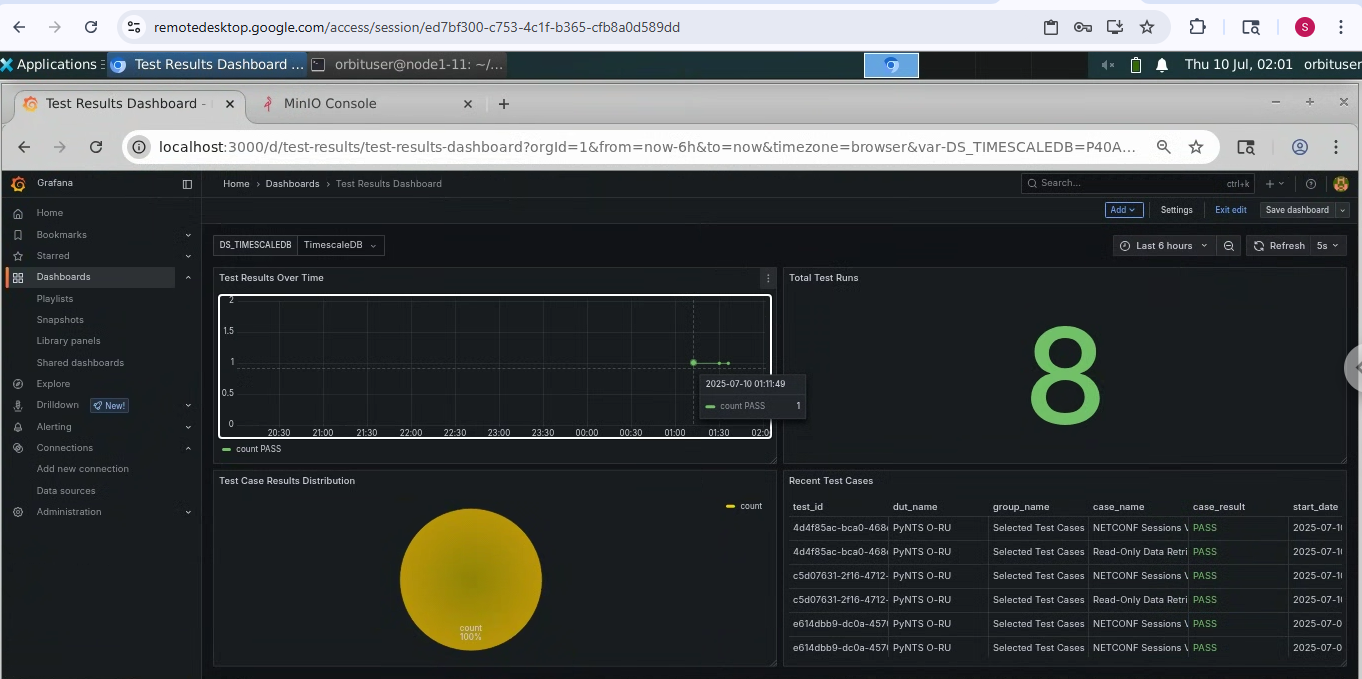
- Test Results Dashboard:
- Provides a summary view of all test runs executed via the framework.
- Useful for tracking overall testing trends, result history, and performance metrics.
- Filters by test case, timestamp, or execution environment.
Backend Data Source – TimescaleDB:
- Grafana reads its data in this project from TimescaleDB, a time-series database built on PostgreSQL.
- Test results and metrics are stored in TimescaleDB by the test framework during execution, and Grafana connects to it as its primary data source.
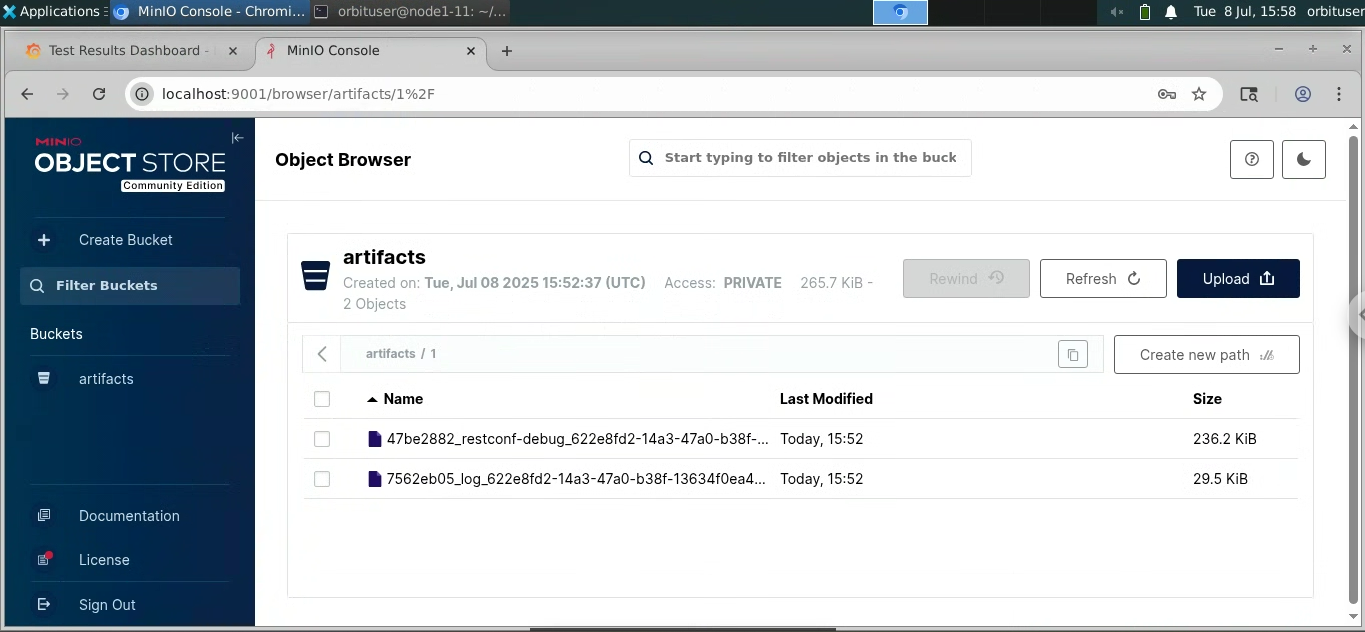
MinIO Console

Week 8
Week 9
Week 10
Additional Documents
Attachments (21)
- O-RU_ACCoRD_CloudBased.pdf (955.7 KB ) - added by 11 months ago.
- O-RAN.Overview-of-the-O-RAN-ALLIANCE-presentation.pdf (2.4 MB ) - added by 11 months ago.
- hybrid_mplane_testing_framework.pdf (714.4 KB ) - added by 11 months ago.
- Hybrid_M-Plane_Architecture.png (16.6 KB ) - added by 11 months ago.
- O-RAN_Deployment_Models.png (423.7 KB ) - added by 11 months ago.
- docker_containers_setup.png (63.0 KB ) - added by 11 months ago.
- Docker_Containers_Status.png (94.8 KB ) - added by 11 months ago.
- Odlux_Login_Page.png (177.7 KB ) - added by 11 months ago.
- ODLUX_Website_Landing_Page.png (325.8 KB ) - added by 11 months ago.
- Containers_Odlux.png (230.4 KB ) - added by 11 months ago.
- Containers_Logs_Odlux.png (291.1 KB ) - added by 11 months ago.
- TestCase_Result.png (27.7 KB ) - added by 11 months ago.
- Grafana.png (287.6 KB ) - added by 11 months ago.
- MINIO_Console.png (334.9 KB ) - added by 11 months ago.
- Testcase_Results.png (445.6 KB ) - added by 10 months ago.
- Artifacts_1.png (527.9 KB ) - added by 10 months ago.
- Artifacts_2.png (138.4 KB ) - added by 10 months ago.
- Artifacts_3.png (130.4 KB ) - added by 10 months ago.
- Testcases.png (64.7 KB ) - added by 10 months ago.
- New_TestCase_HybridMplane.png (26.1 KB ) - added by 10 months ago.
- NewTestCase_Description_Image.png (5.1 KB ) - added by 10 months ago.