
| Version 60 (modified by , 11 months ago) ( diff ) |
|---|
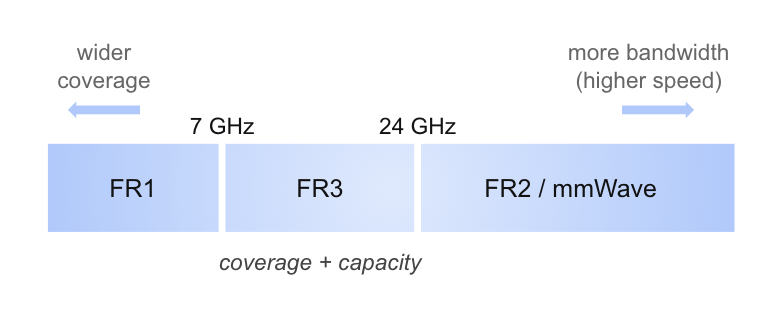
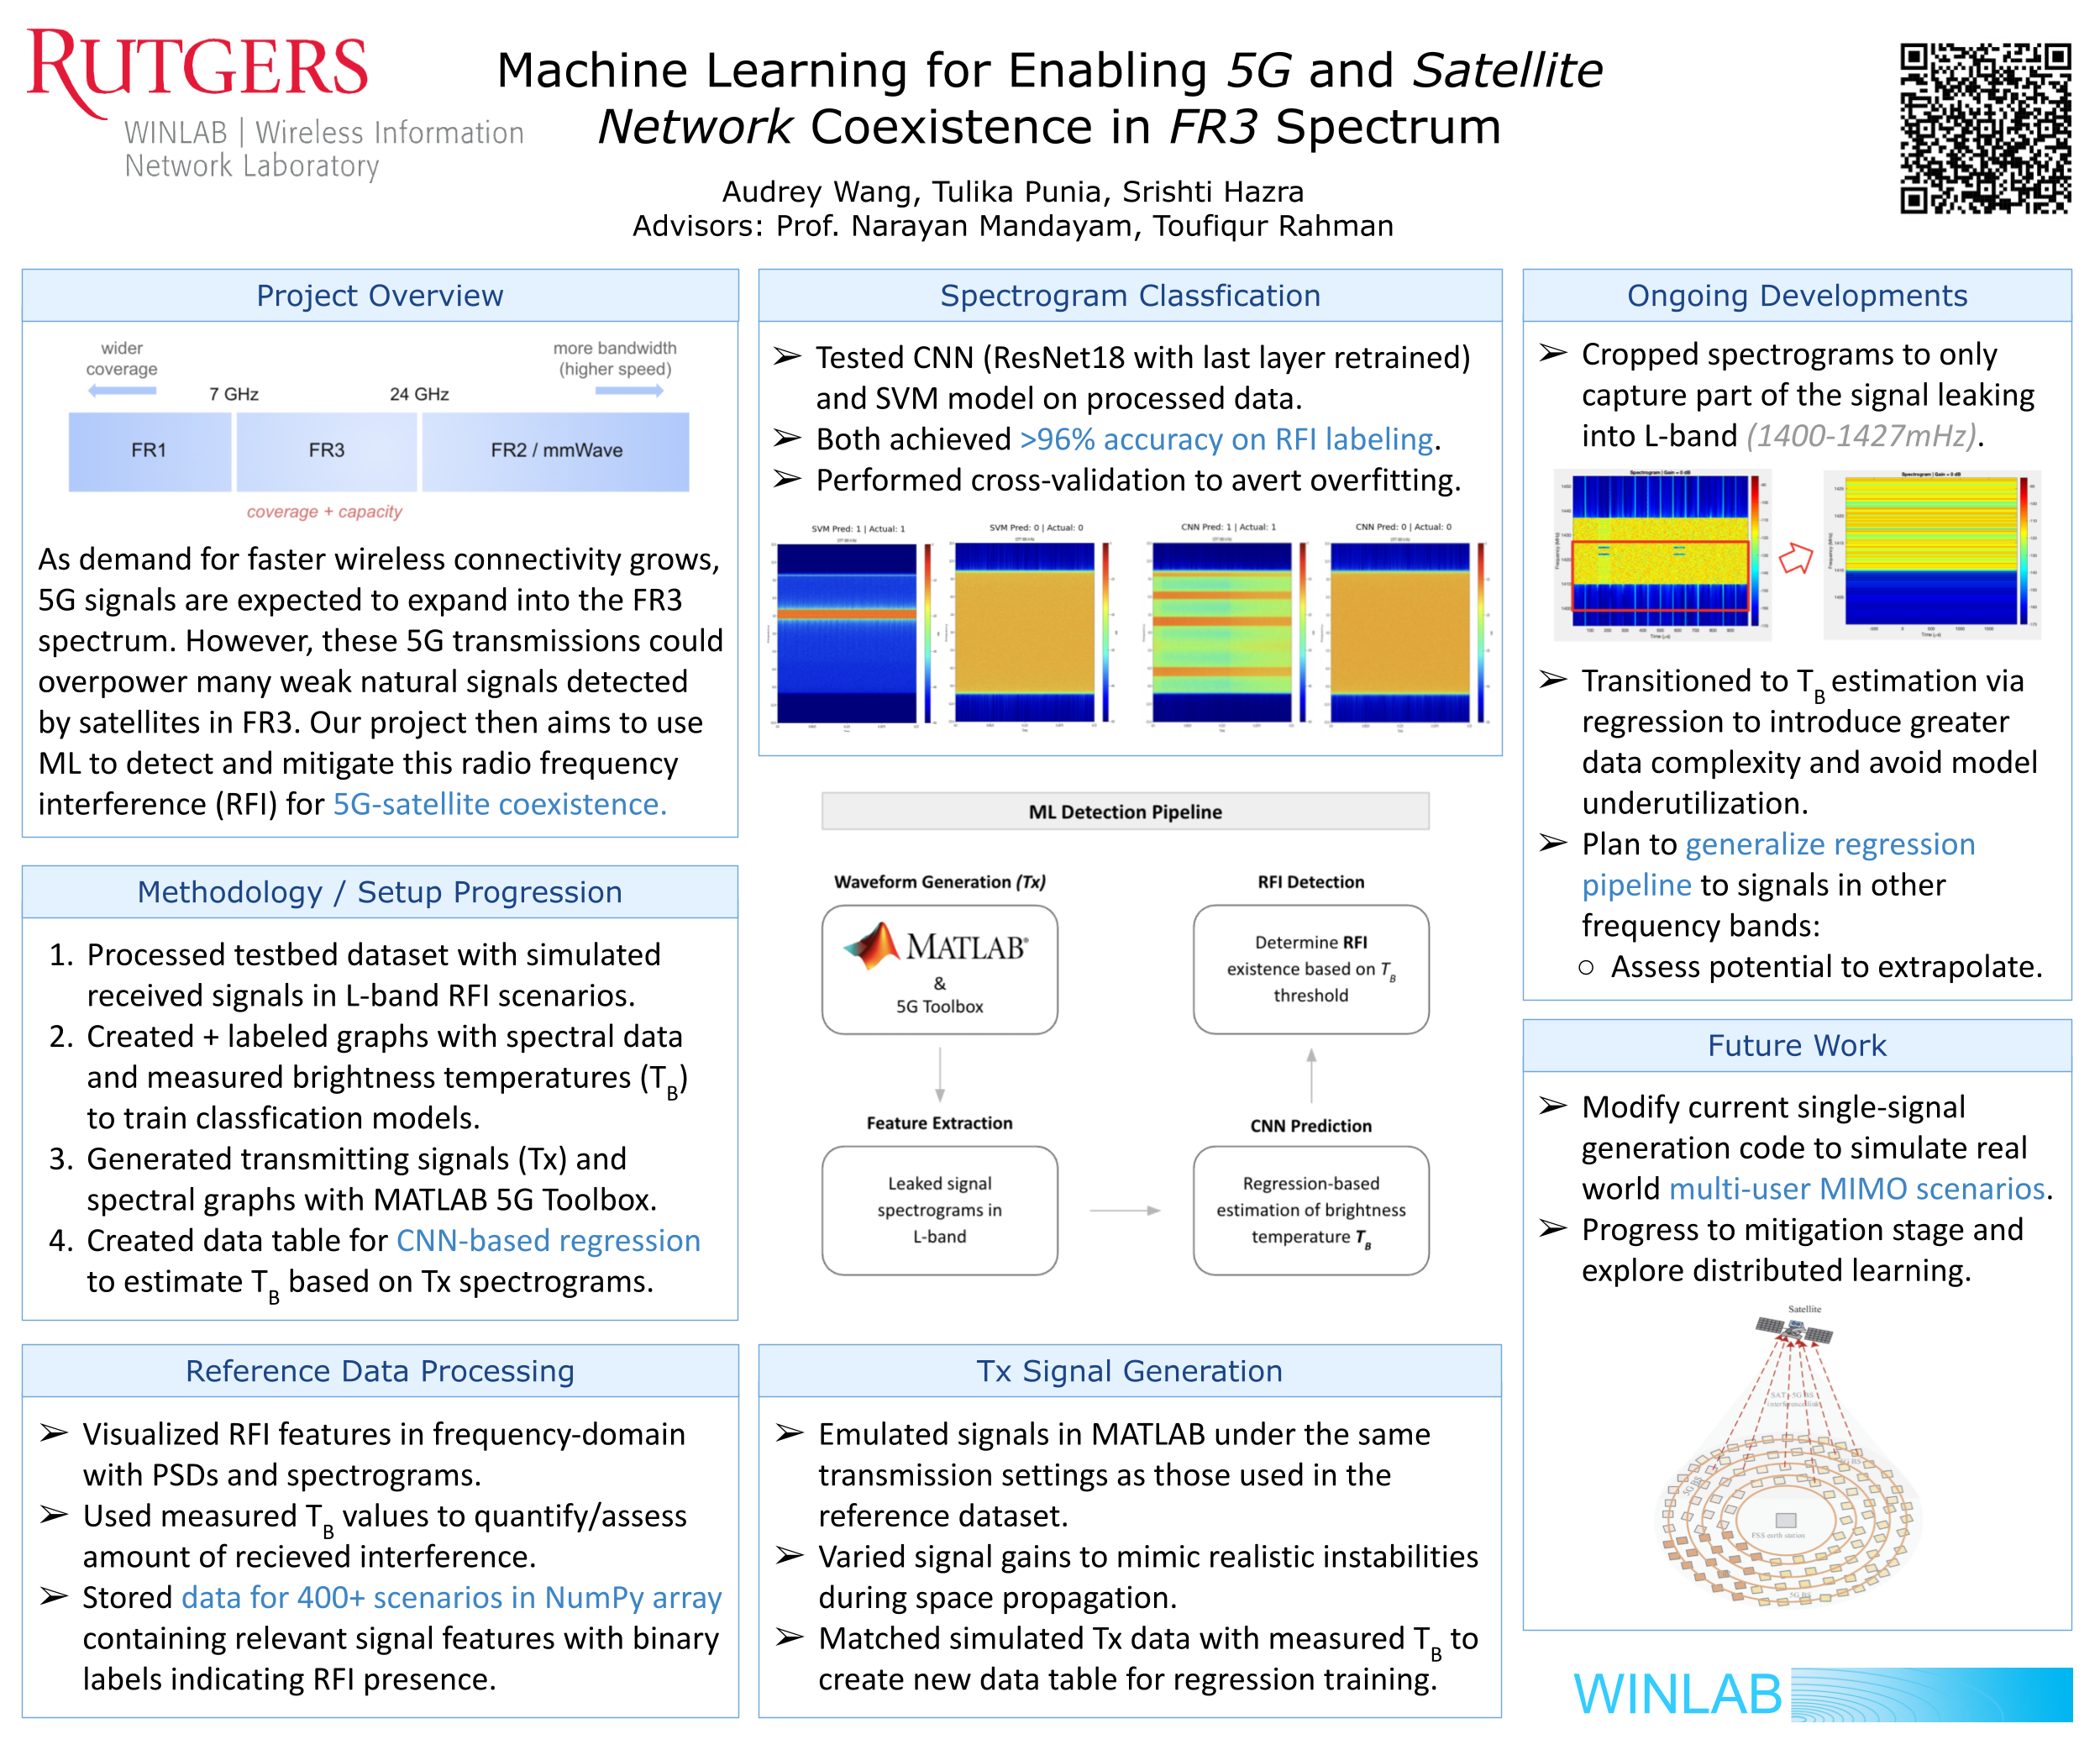
Machine Learning for Enabling 5G and Satellite Network Coexistence in FR3 Spectrum
WINLAB Summer Internship 2025
Group Members: Audrey Wang, Tulika Punia, Srishti Hazra
Week 1 (5/27 - 5/29):
Slides: Week 1 Presentation
Progress:
- Conducted literature review on relevant research papers
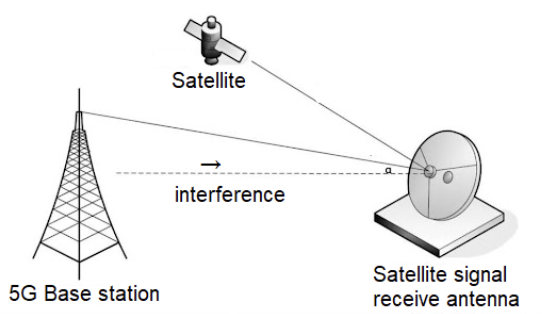
- Understood the high level idea of what Radio Frequency Interference(RFI) and frequency allocations are
- Explored how ML can be implemented to minimize the interference between satellite and 5G in different spectrums


Week 2 (6/2 - 6/5):
Slides: Week 2 Presentation
Progress:
- Familiar with the pros and cons of the different approaches to beam-forming, especially the benefits of ML application
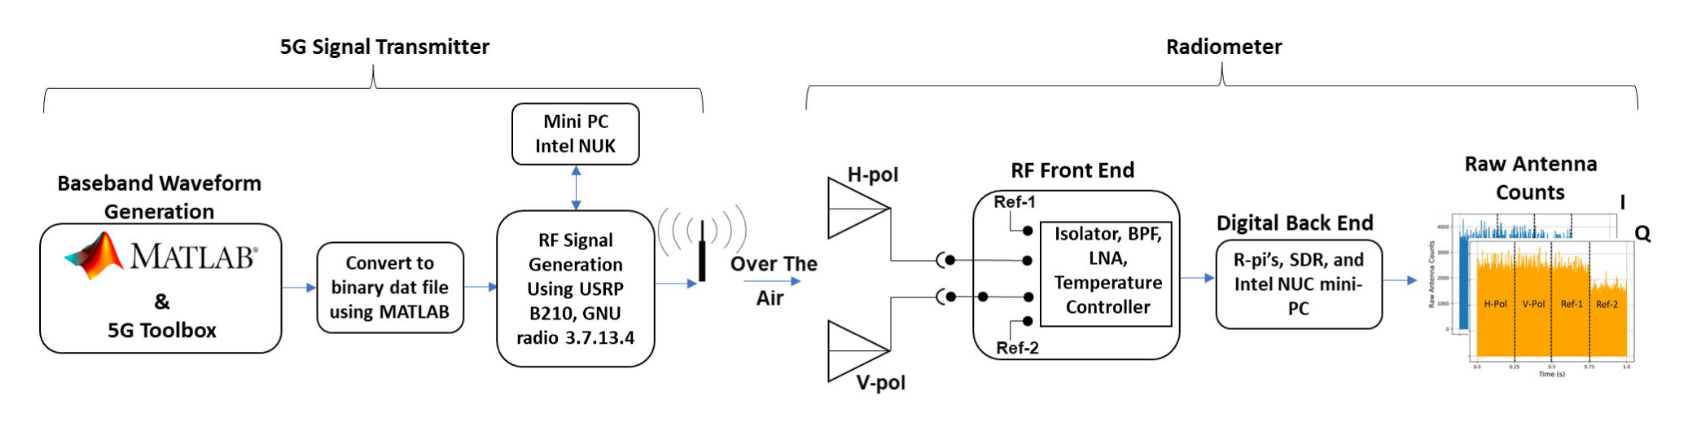
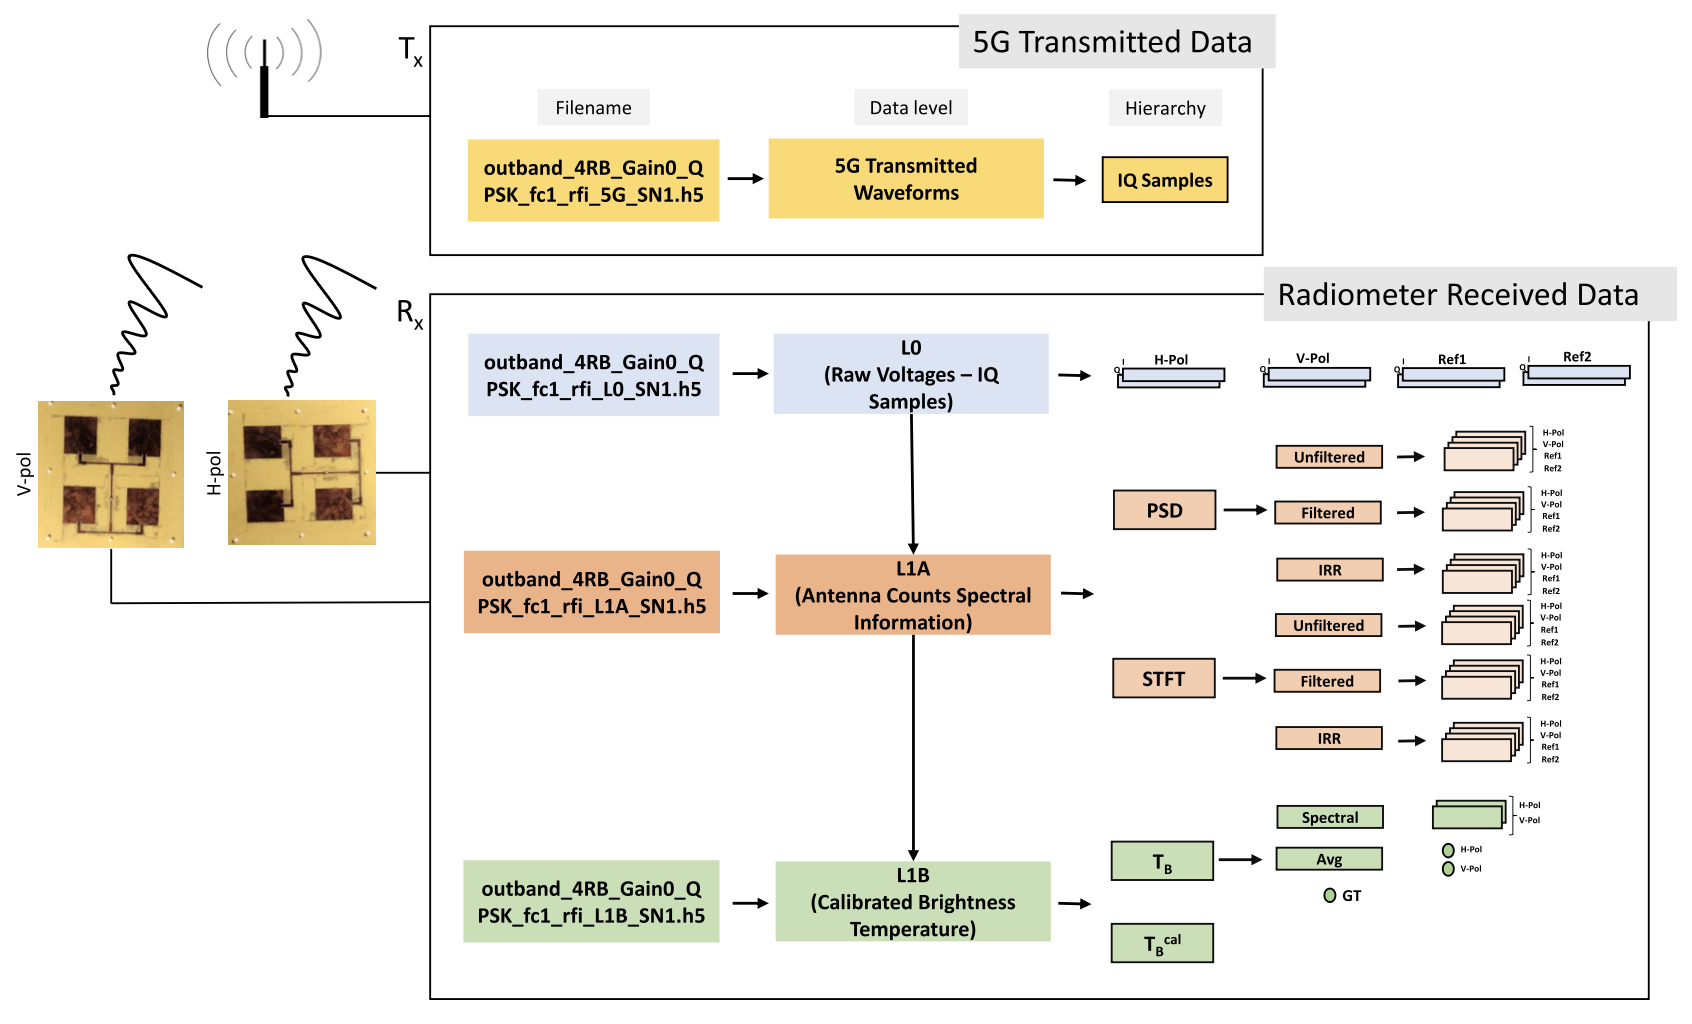
- Read research papers related to a physical-testbed-generated RFI dataset, and got familiar with the data generation process:
- A Physical Testbed and Open Dataset for Passive Sensing and Wireless Communication Spectrum Coexistence
- Microwave Radiometer Calibration Using Deep Learning With Reduced Reference Information and 2-D Spectral Features
- Radio Frequency Interference Detection for SMAP Radiometer Using Convolutional Neural Networks

Week 3 (6/9 - 6/12):
Slides: Week 3 Presentation
Progress:
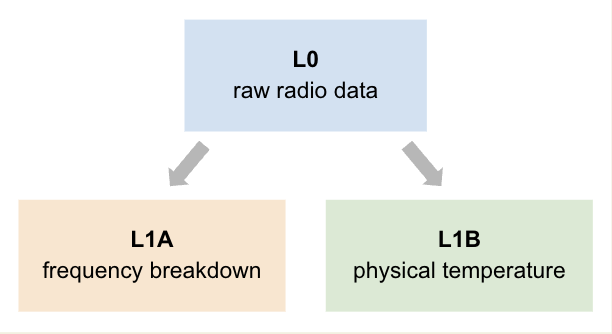
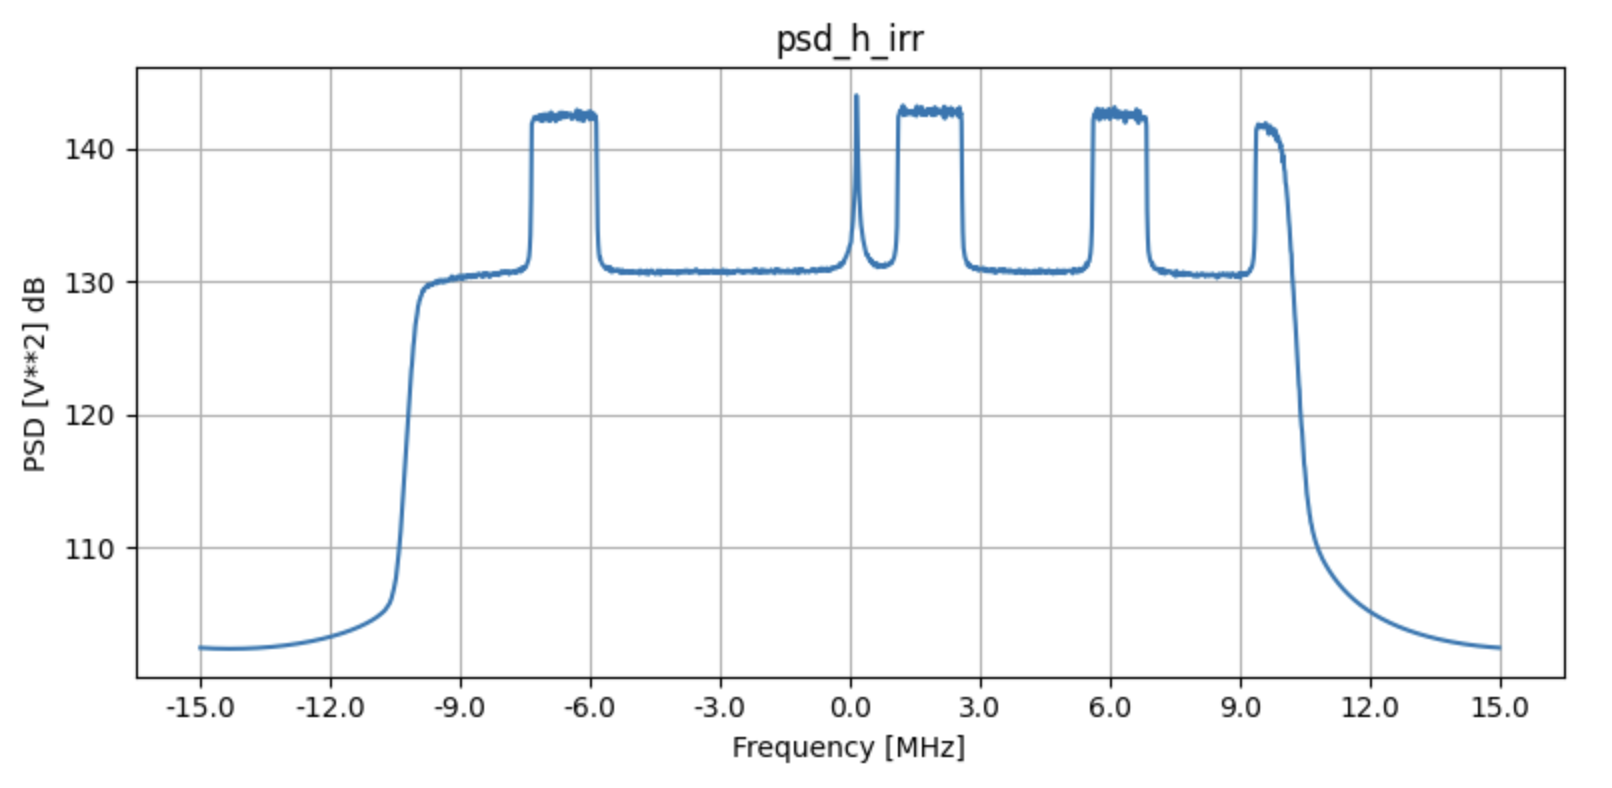
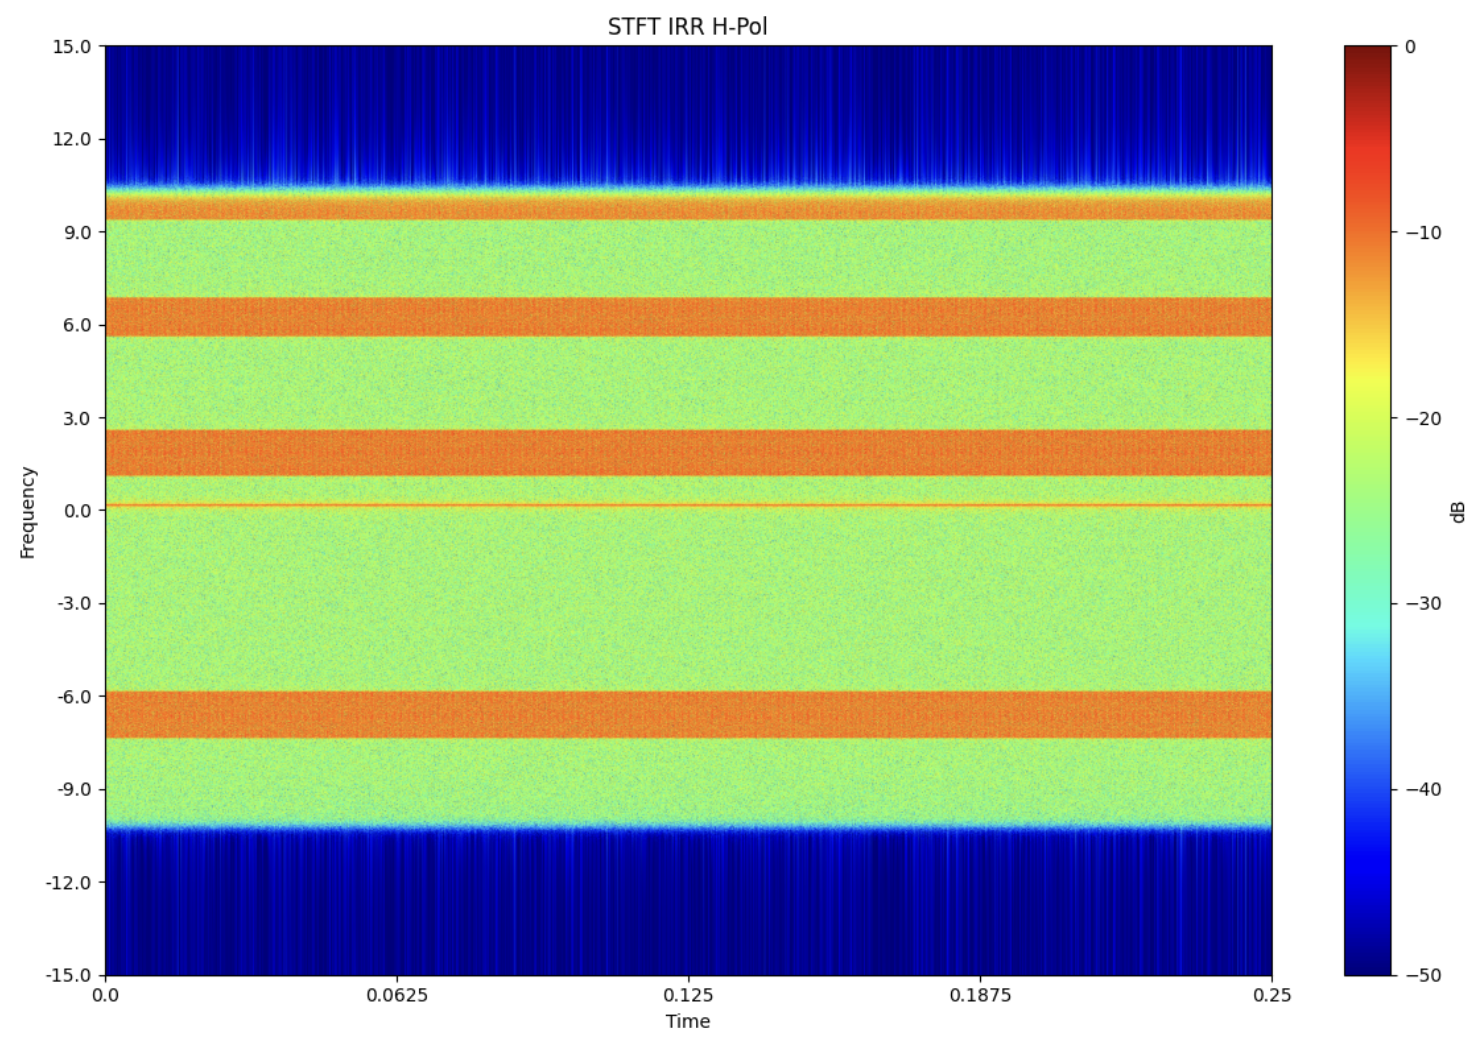
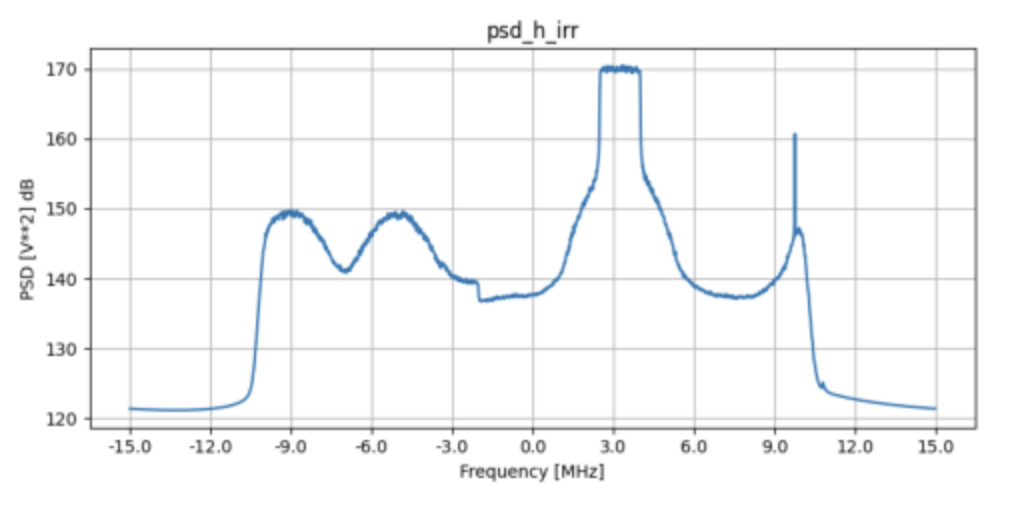
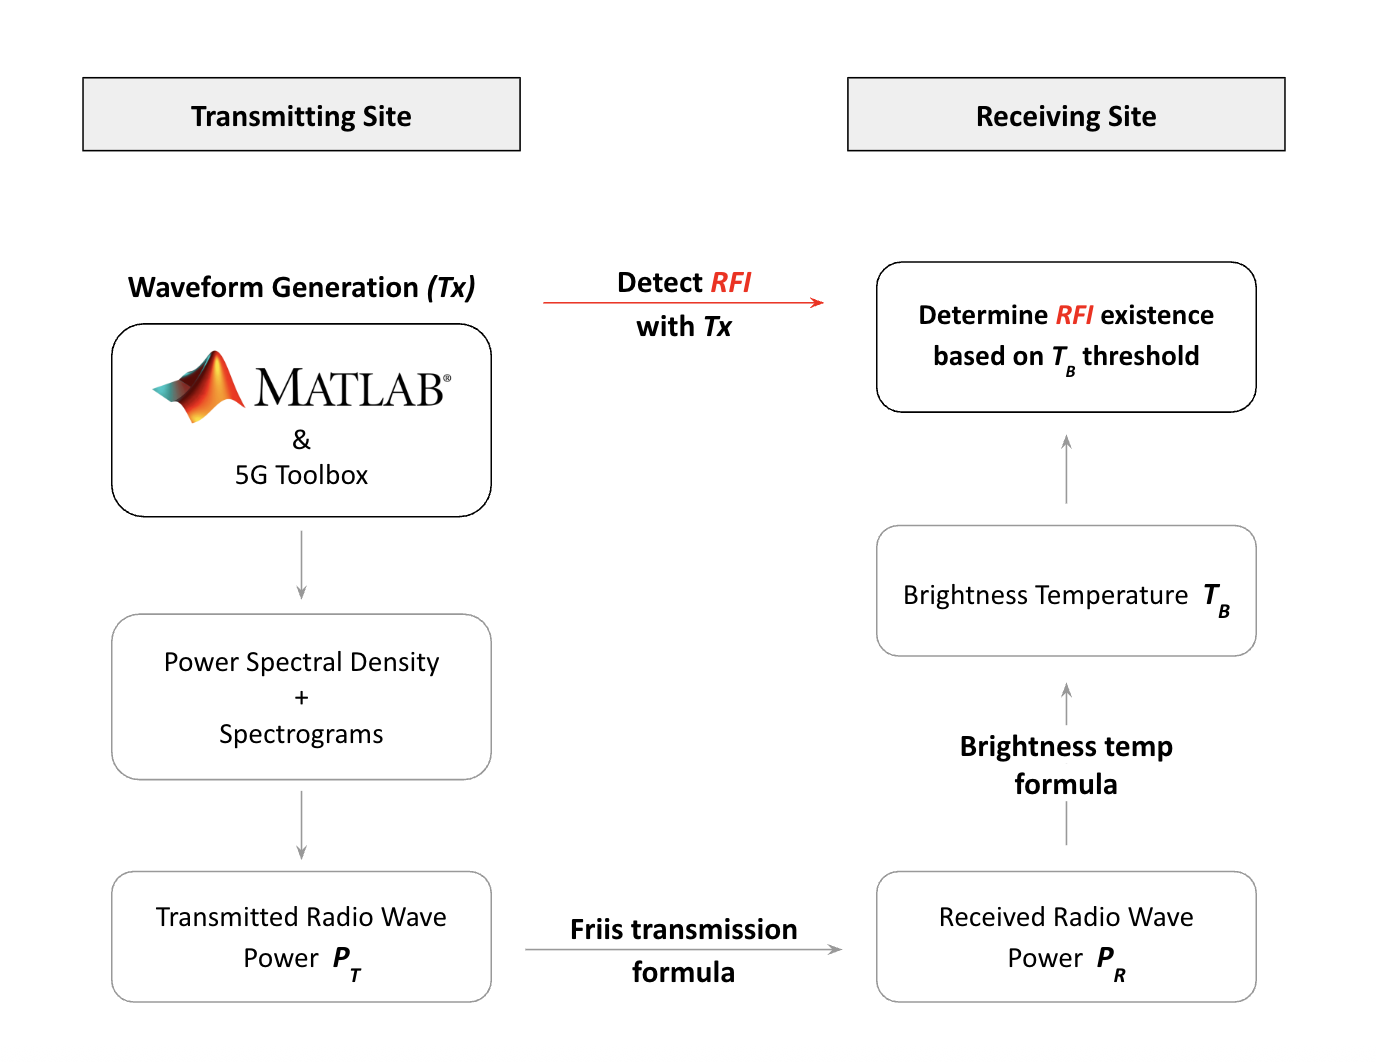
- Began to process data with Numpy and h5py, generating Power Spectral Density (PSD) graphs and spectrograms from L1A data
- Utilized the radiometer's ability to interpret all received power as thermal radiation to quantify RFI by detecting abnormal temperature increases
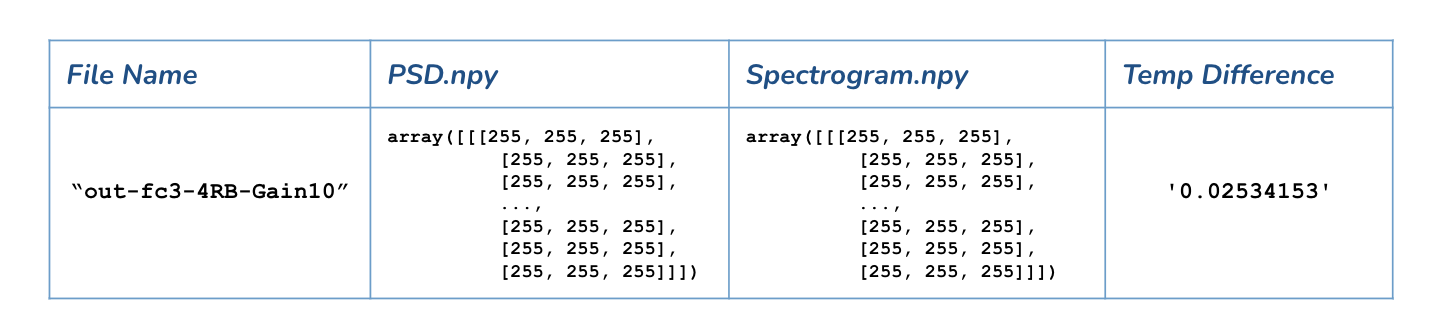
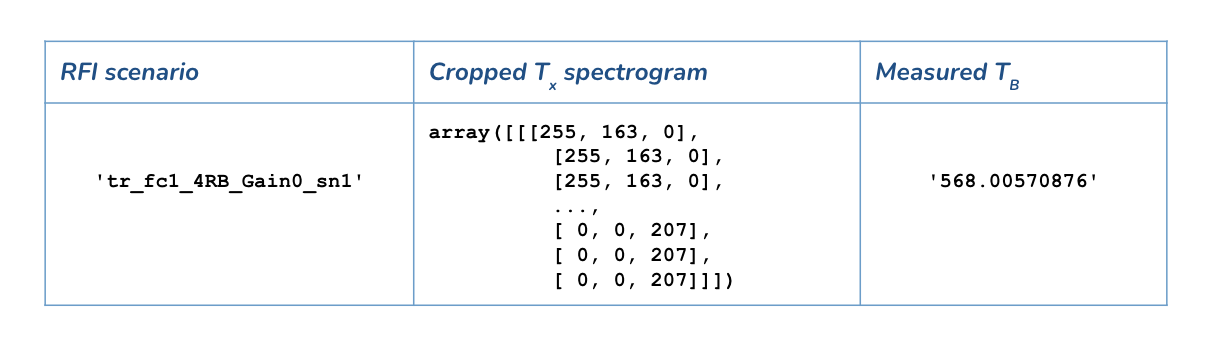
- Saved plotted graphs into a 2D Numpy array for future model training use (4 columns: RFI Scenario | PSD | Spectrogram | Temp Difference)

Week 4 (6/16 - 6/19):
Slides: Week 4 Presentation
Progress:
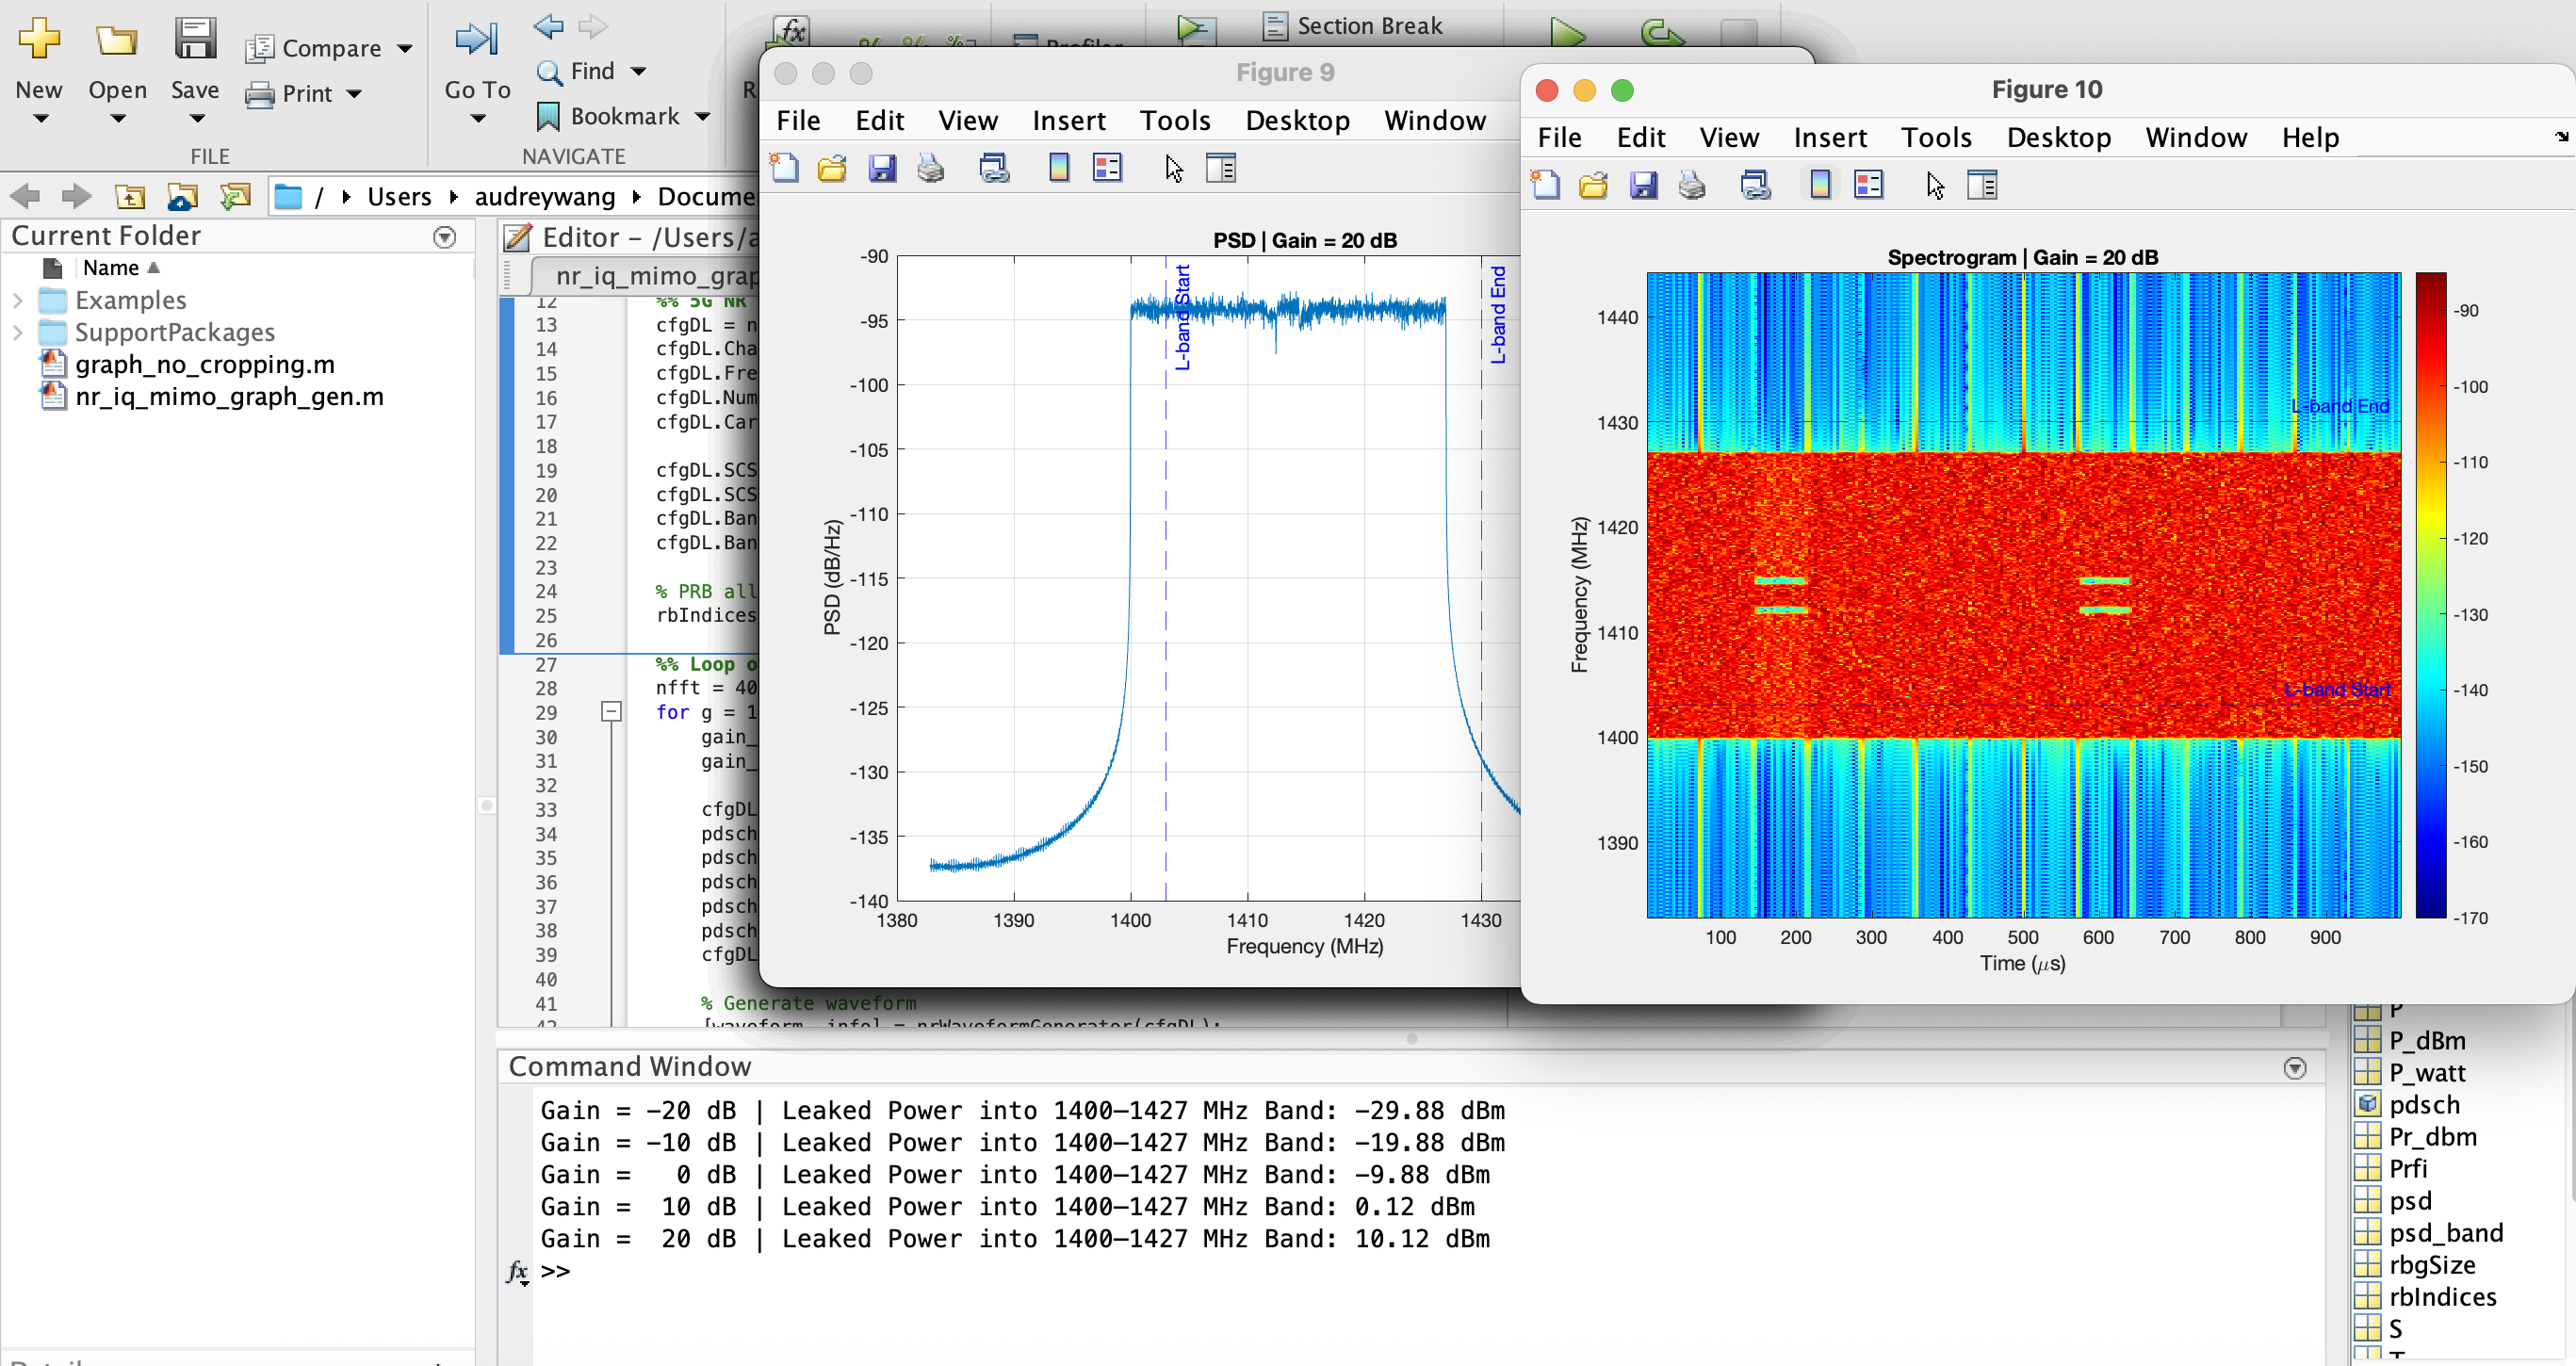
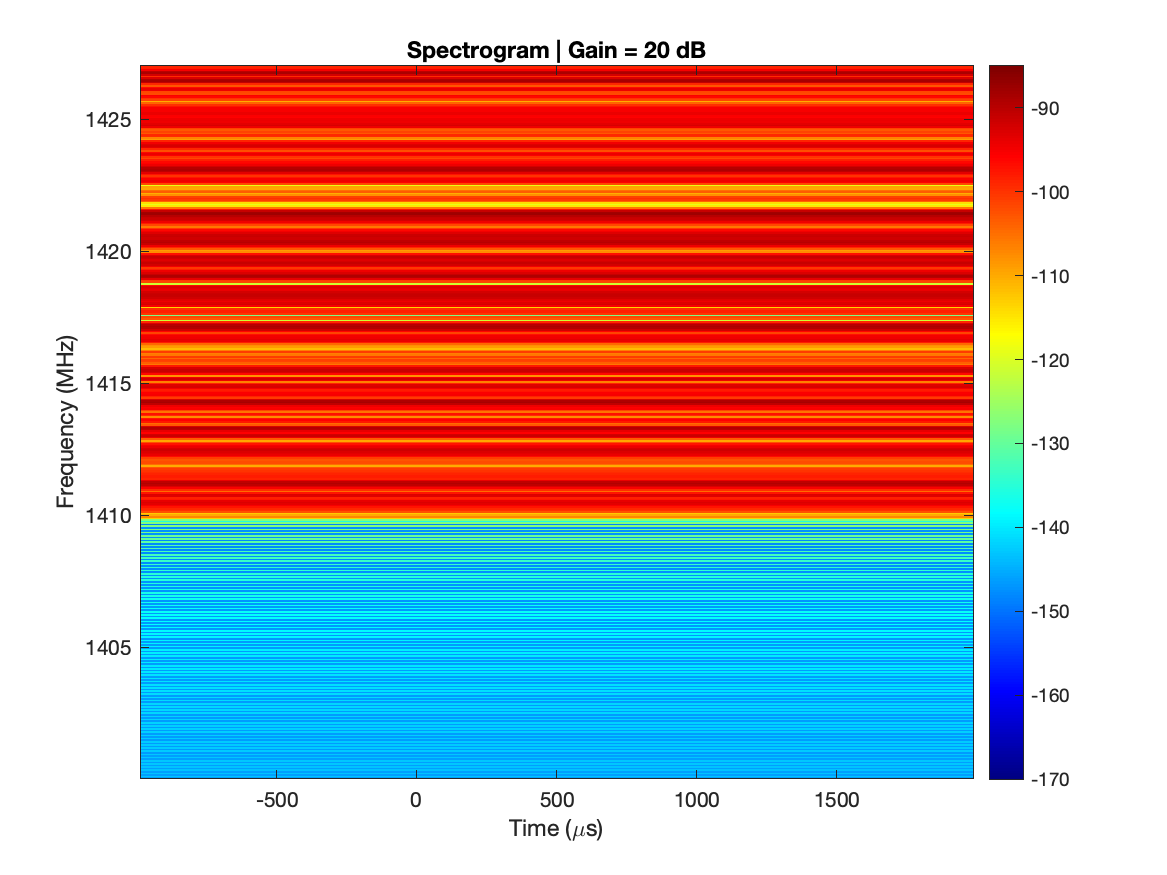
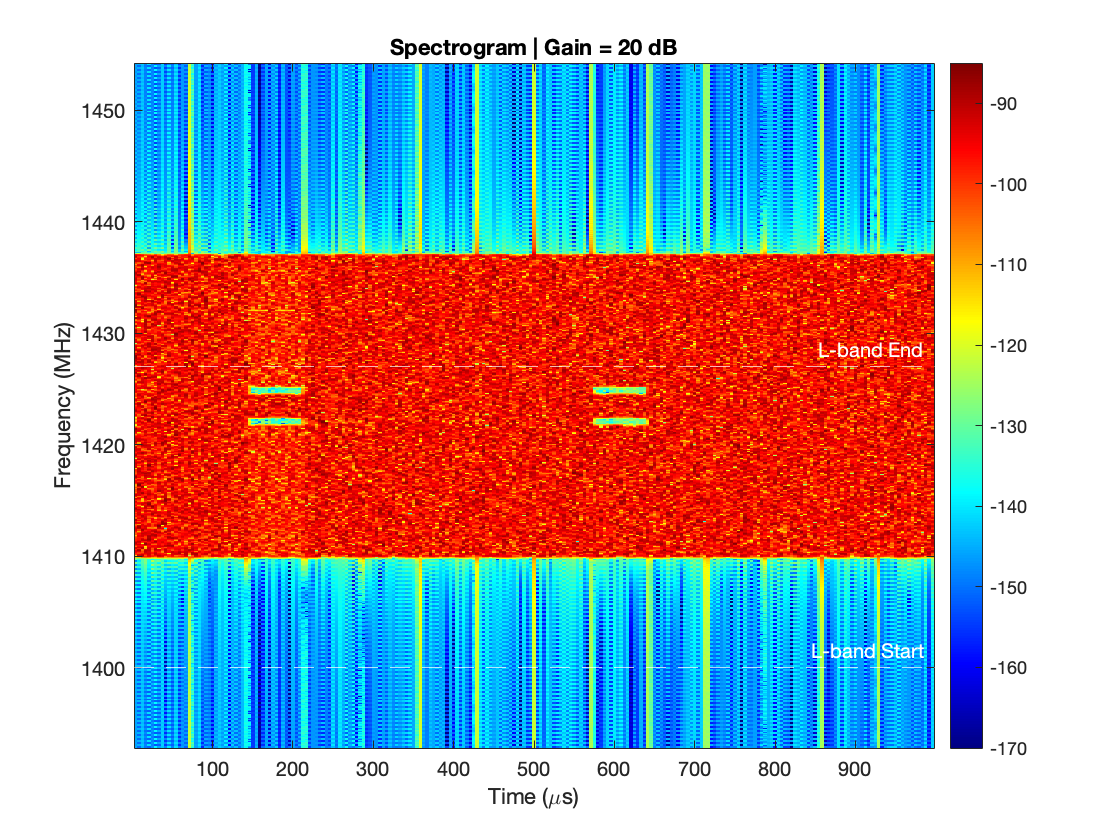
- Continued generating PSDs and spectrograms using Jupyter Notebook (link to code)

- Sample PSD and spectrogram for RFI scenario "tr_fc0_4RB_Gain-20_sn2" (transition band; central frequency 0; 4 resource blocks; gain -20; sample number 2)


Week 5 (6/23 - 6/26):
Slides: Week 5 Presentation
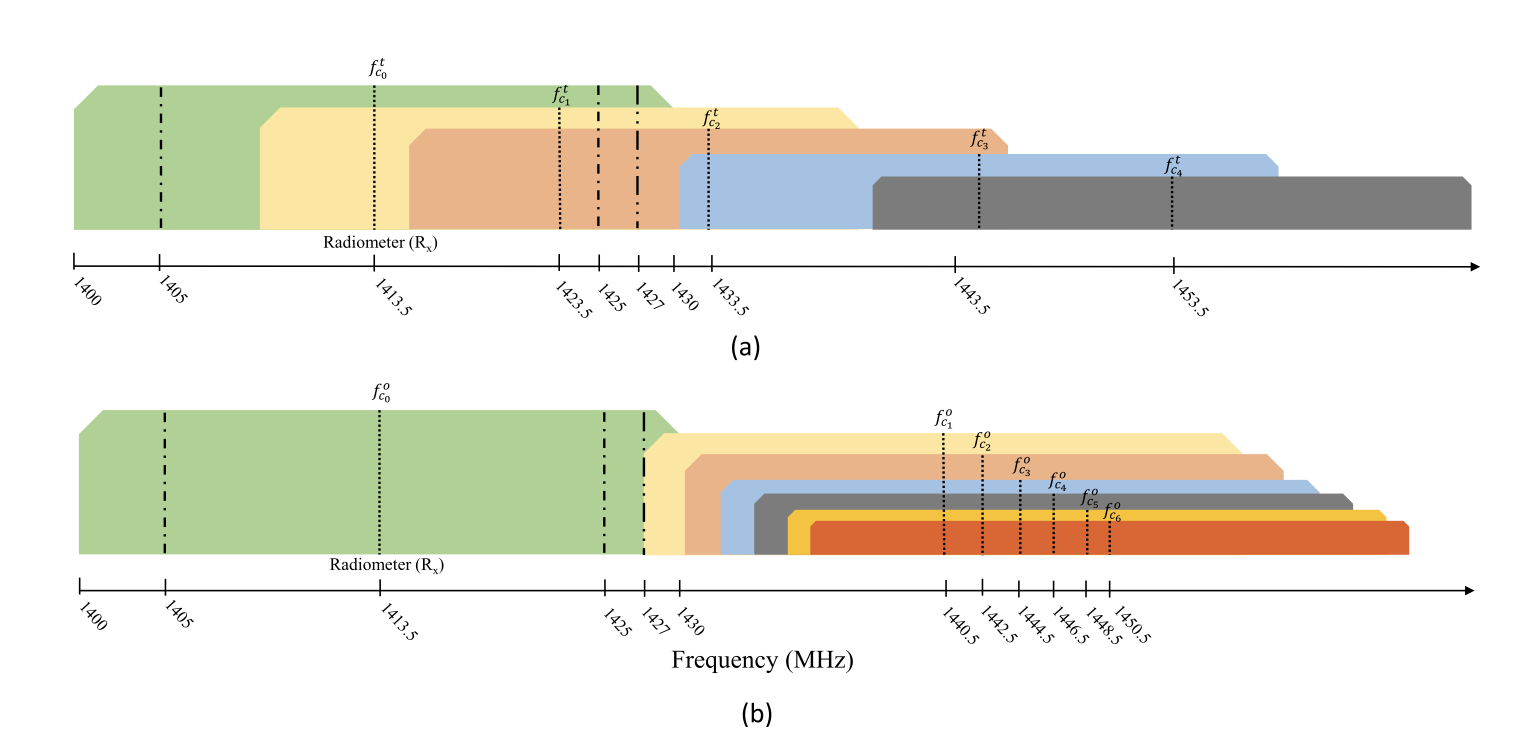
- In progress to generate all graphs for fc1, 2, 3 for both a) transition-band and b) out-of-band scenarios

Week 6 (6/30 - 7/3):
Slides: Week 6 Presentation
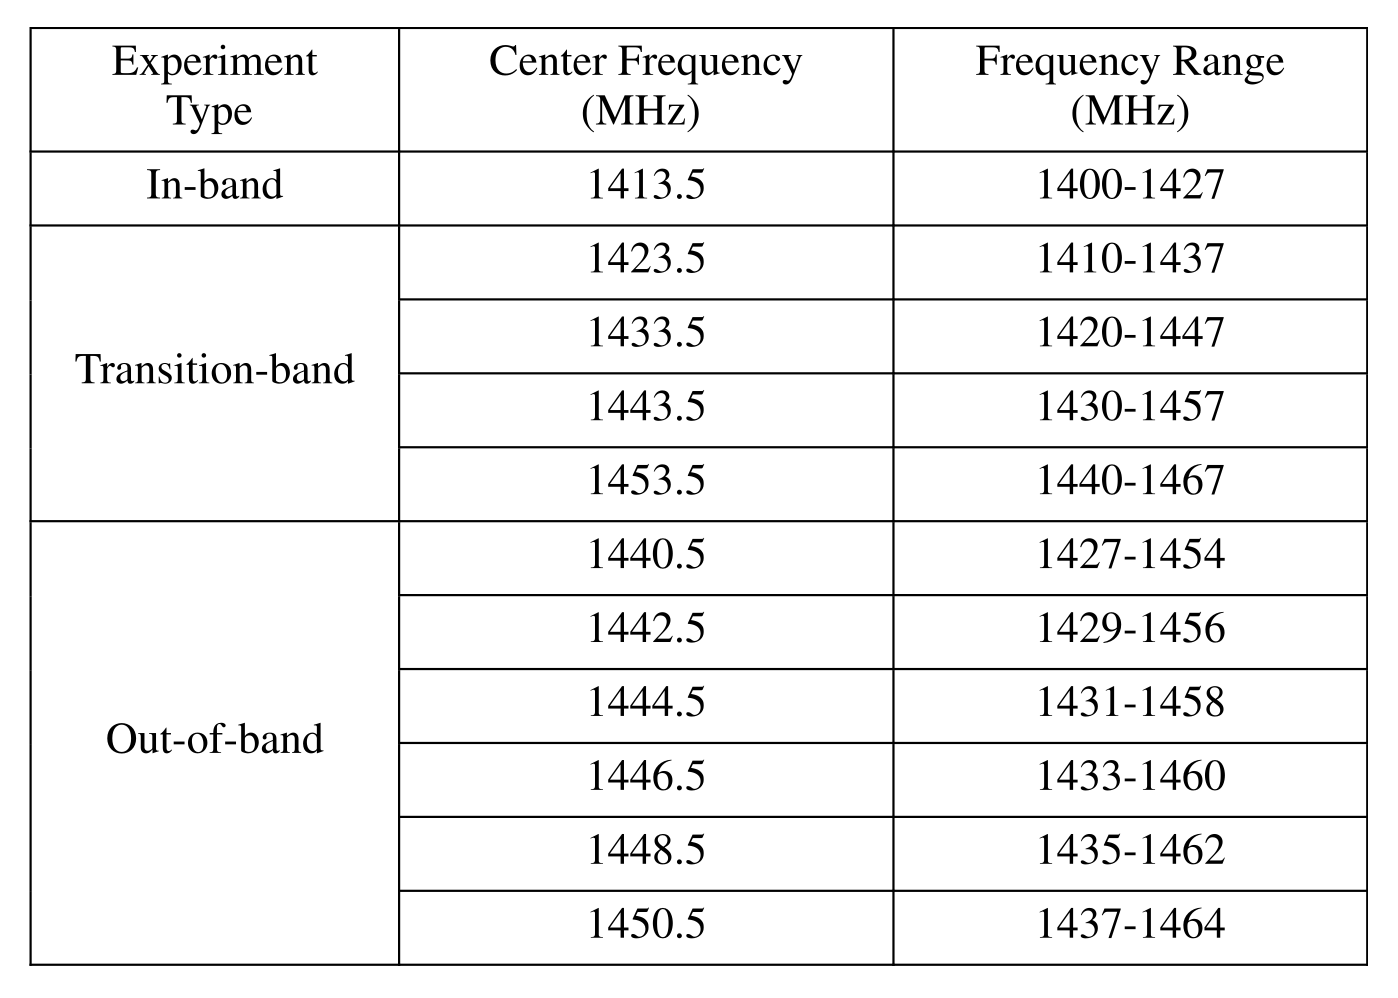
- Finished generating 348 sets of graphical data for the following inference scenarios:
- Center frequencies 1423.5mHz(fc1), 1433.5mHz(fc2), 1443.5mHz(fc3) for transition band
- Center frequencies 1440.5mHz(fc1), 1442.5mHz(fc2), 1444.5mHz(fc3) for out-of-band
- Identified clean vs. RFI-contaminated signal shapes in Power Spectral Density (PSD) plots:
- Uniform (Clean): flat-top spectrum, power emitted uniformly across bandwidth
- Spikes (RFI): abrupt, sharp spikes in power at random frequency levels
Week 7 (7/7 - 7/10):
Slides: Week 7 Presentation
Progress:
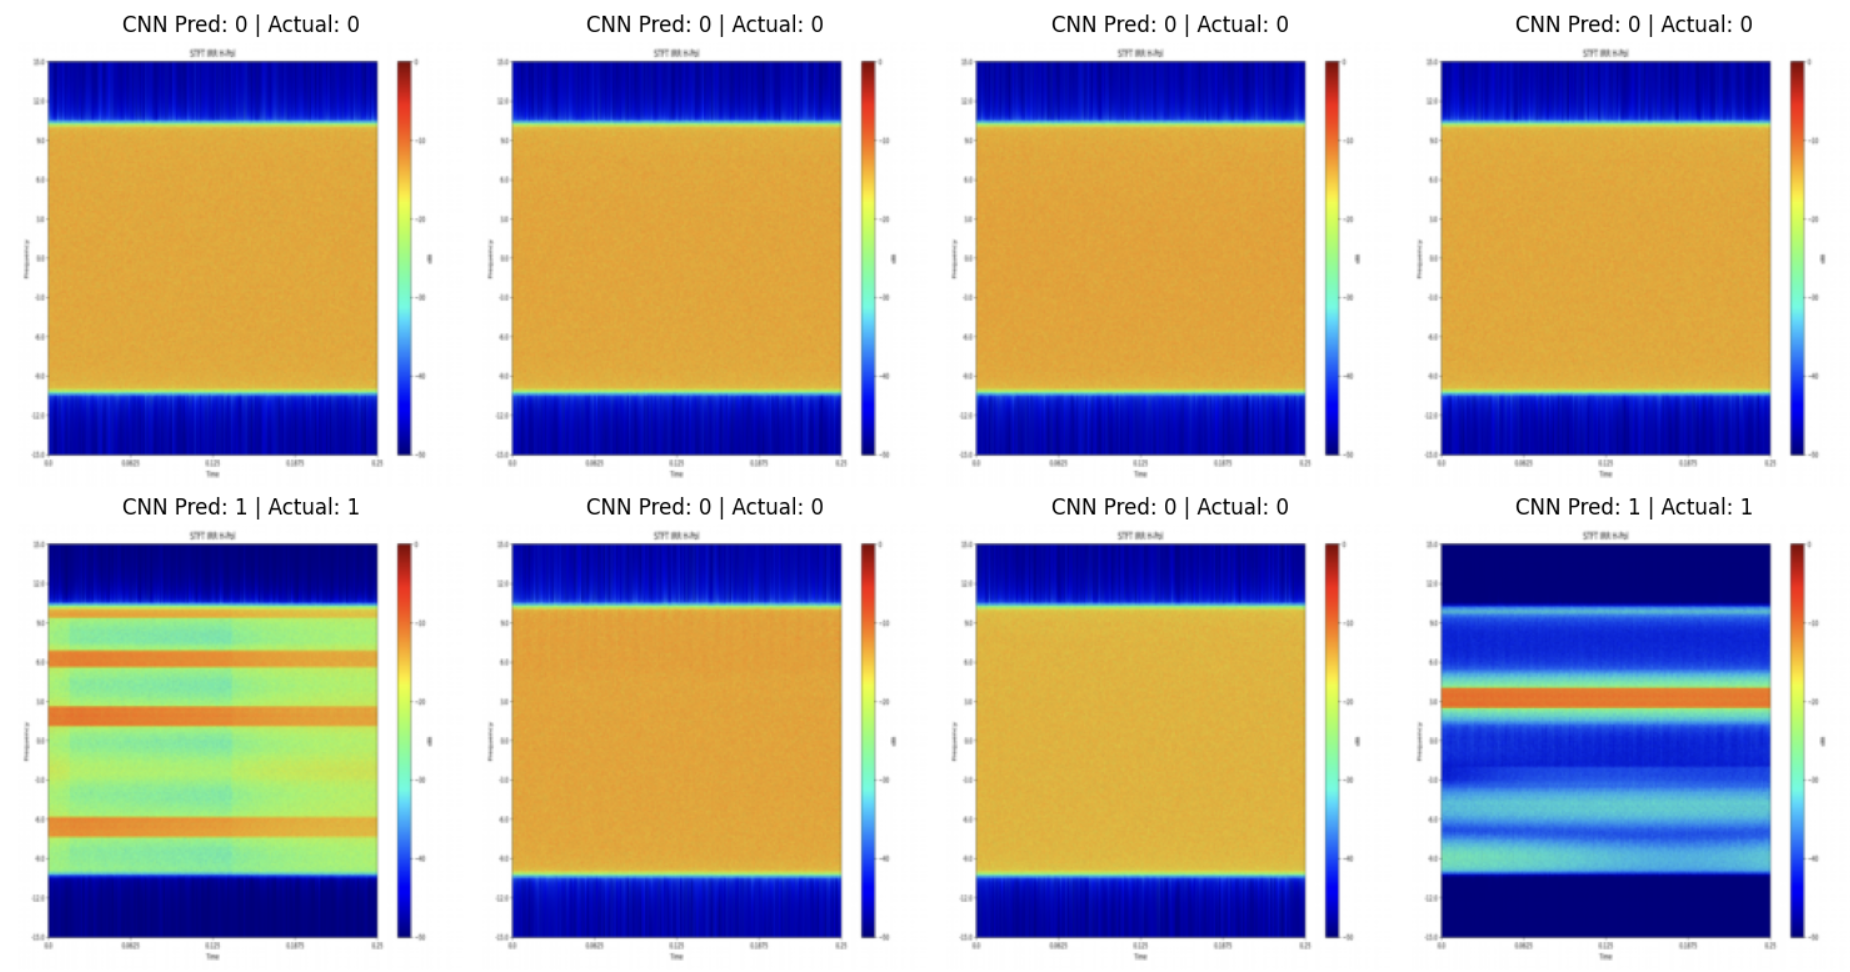
- ML Models
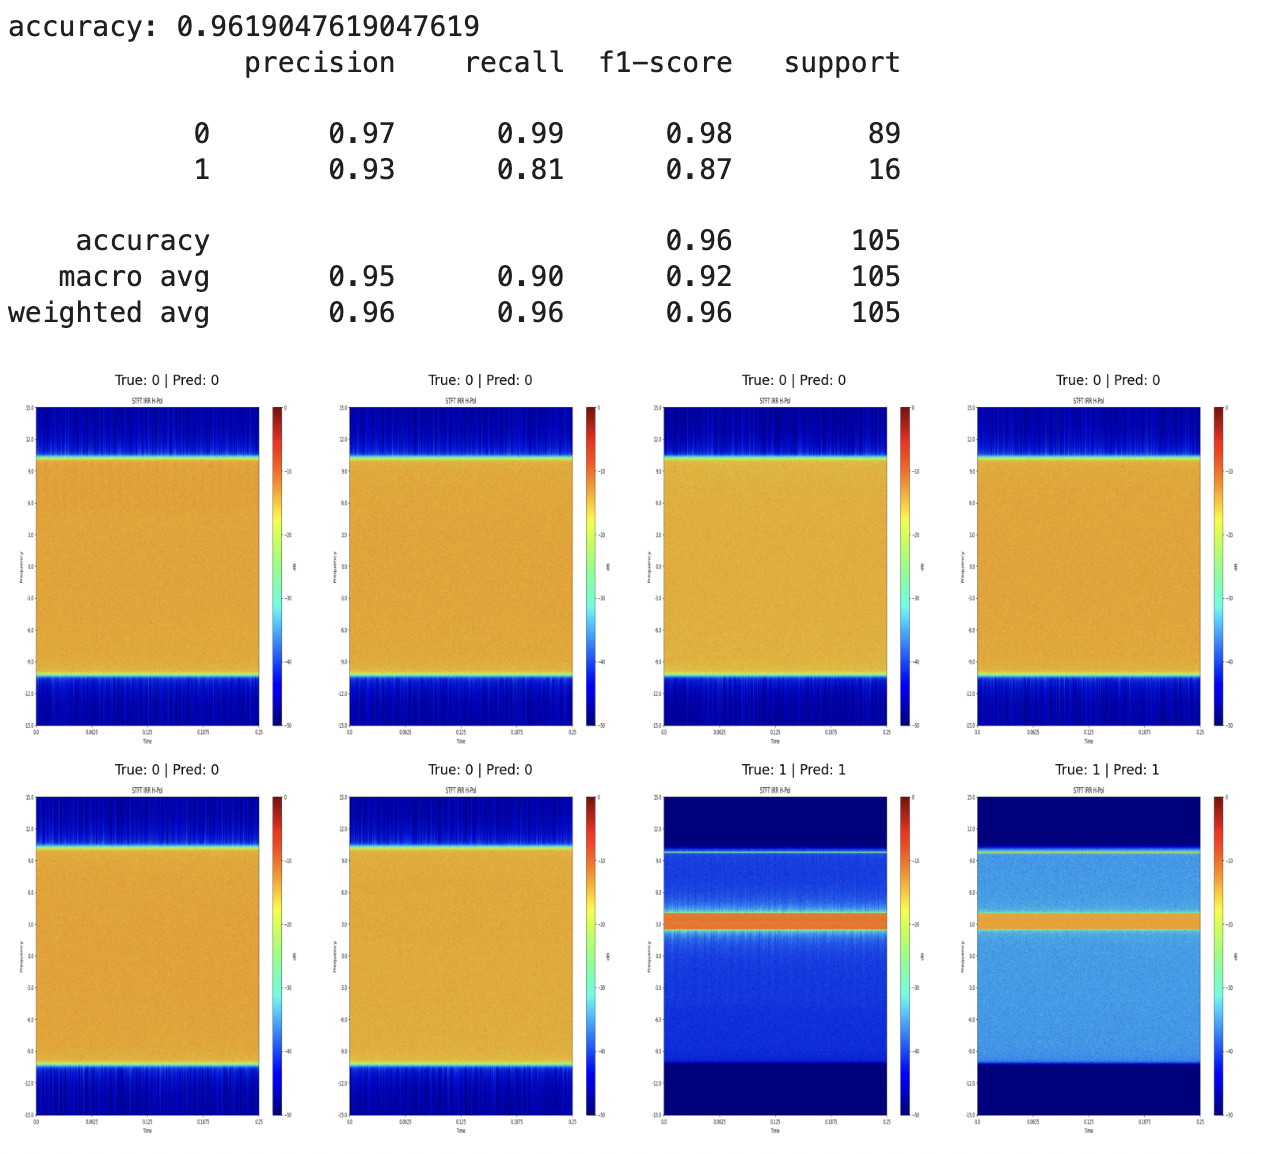
- Developed a CNN for RFI detection using pre-trained model (ResNet-18) with the last classification layer modified and retrained
- Developed SVM as a baseline to assess the efficiency of the CNN approach (potentially underutilization of the neural network)
- Performed cross-validation to make sure the models were not overfitting
- Both models reached >95% accuracy
- Continued obtaining data from transition band (100 additional rows in dataTable)
- Identified Friis Transmission Formula & Stefan-Boltzmann Law which will be used to find beam efficiency
Week 8 (7/14 - 7/17):
Slides: Week 8 Presentation
Attachments (24)
- Spectrum Diagram.png (69.0 KB ) - added by 12 months ago.
- 5G Interference.png (79.5 KB ) - added by 12 months ago.
- Data Generation Schematic.png (240.6 KB ) - added by 12 months ago.
- Dataset structure.png (27.0 KB ) - added by 11 months ago.
- Npy Array Shape.png (57.9 KB ) - added by 11 months ago.
- PSD Sample.png (183.8 KB ) - added by 11 months ago.
- Spectrogram Sample.png (2.2 MB ) - added by 11 months ago.
- Frequency Band.png (94.8 KB ) - added by 11 months ago.
- PSD clean.png (109.8 KB ) - added by 11 months ago.
- PSD w: RFI.png (116.3 KB ) - added by 11 months ago.
- Bandwidth table.png (158.2 KB ) - added by 11 months ago.
- File structure.png (301.4 KB ) - added by 11 months ago.
-
SVM.png
(1.6 MB
) - added by 11 months ago.
SVM Results
- CNN pred.png (1.9 MB ) - added by 11 months ago.
- Pipeline.png (141.5 KB ) - added by 11 months ago.
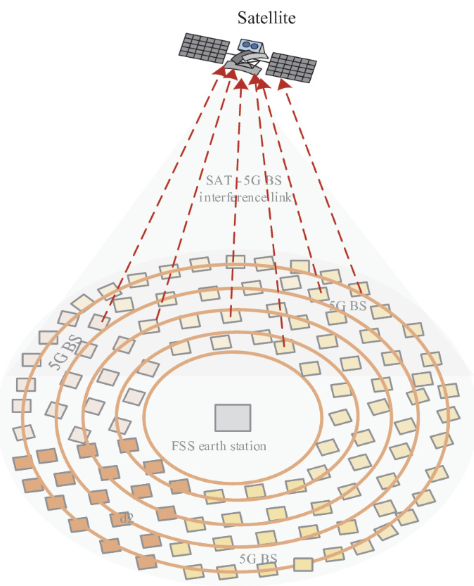
- BS and SAT.png (252.6 KB ) - added by 11 months ago.
- matlab.png (1.2 MB ) - added by 10 months ago.
- cropped.png (36.1 KB ) - added by 10 months ago.
- original.png (341.4 KB ) - added by 10 months ago.
- newDataTable.png (50.4 KB ) - added by 10 months ago.
- poster.png (1.3 MB ) - added by 10 months ago.
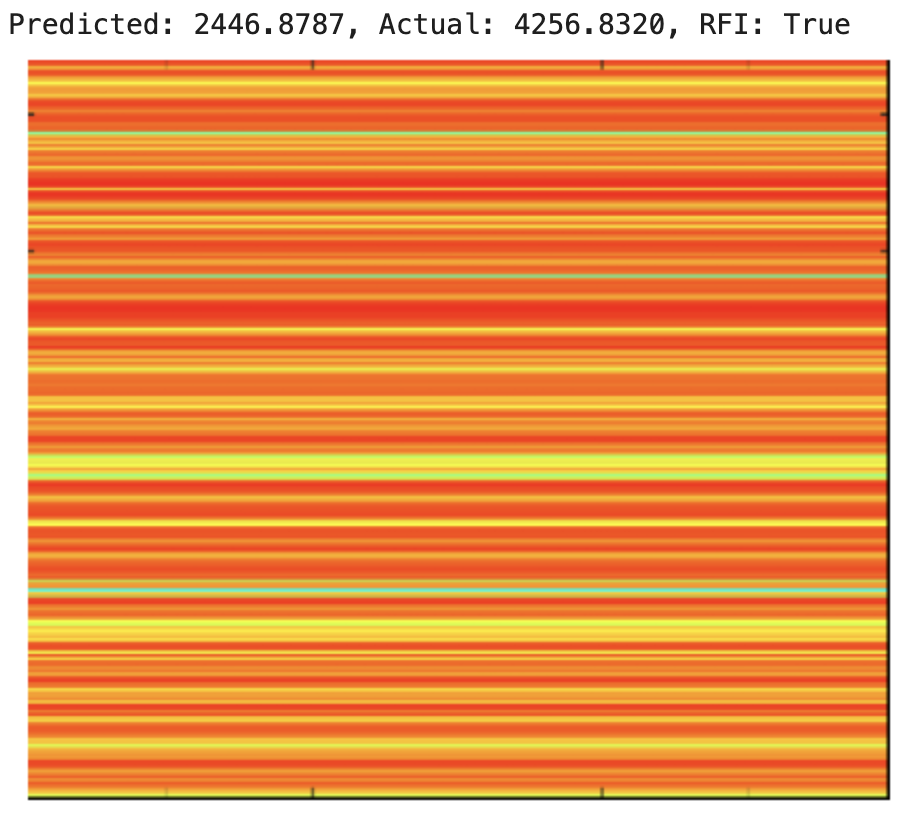
- highTb.png (80.3 KB ) - added by 10 months ago.
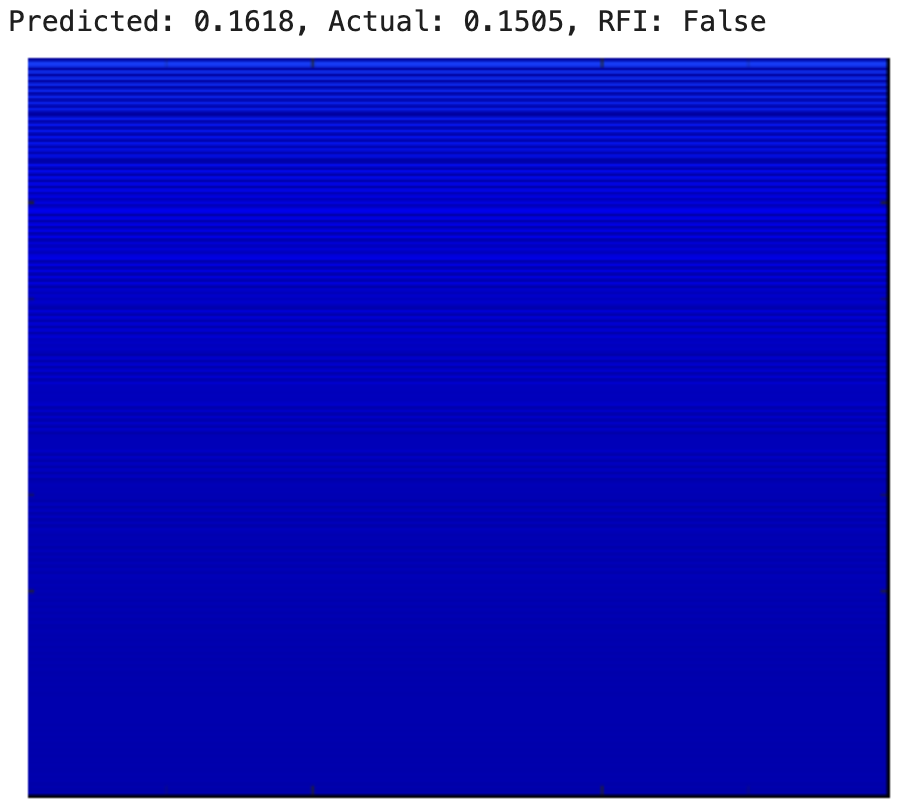
- lowTb.png (44.3 KB ) - added by 10 months ago.
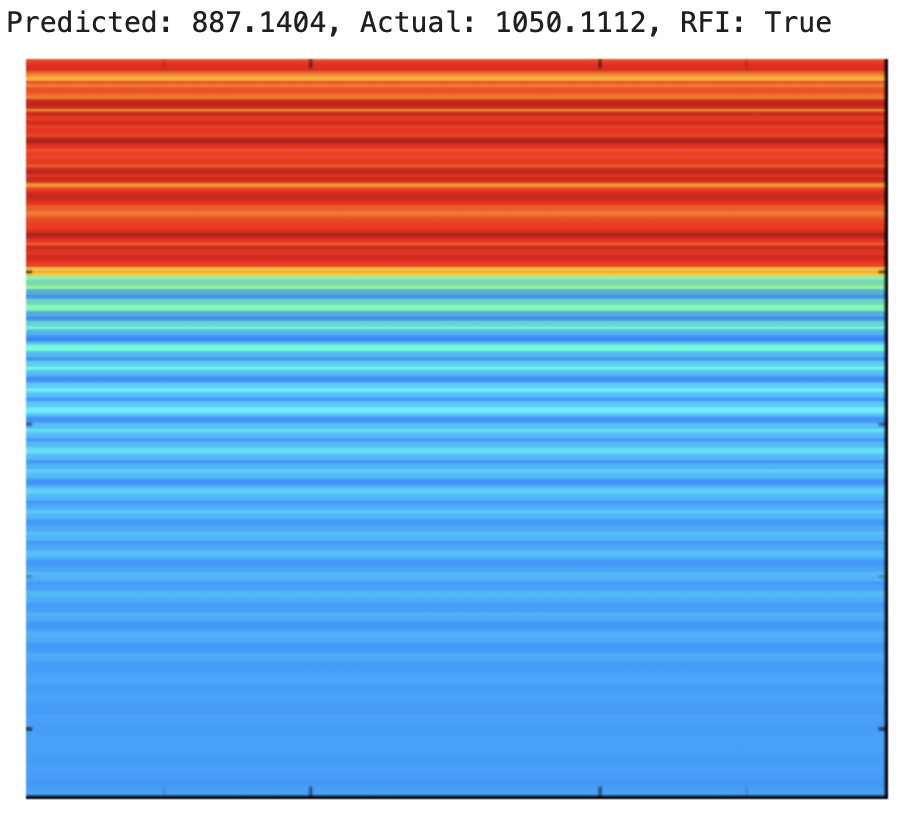
- mediumTb.png (76.8 KB ) - added by 10 months ago.
Note:
See TracWiki
for help on using the wiki.