| Version 15 (modified by , 9 years ago) ( diff ) |
|---|
Multi Channel Sample Processing & Visualization
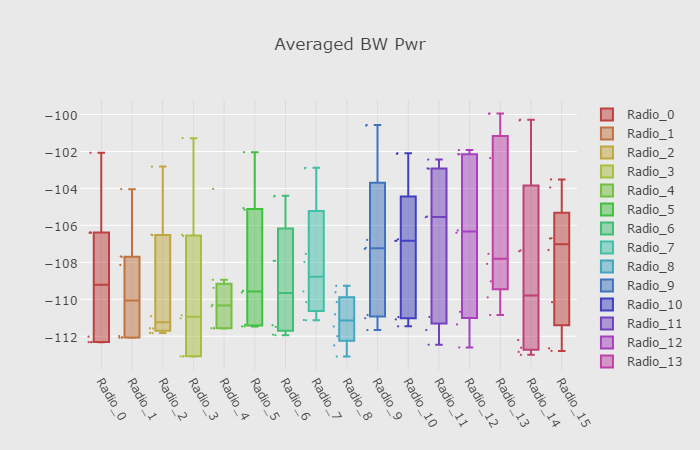
In this example we'll boxplot the received signal strength from several USRP channels on the MIMO rack.
Hardware / software resources utilized
1) upto 16 USRPs on the grid's MIMO rack
2) controller node (ie. node21-1) imaged with ubuntu-14-04-64bit-uhd-003.010.001.001.ndz
3) OML - Orbit Measurement Library to record measurements into database
4) rf_hw_intf - this a multi-channel uhd streaming application to configure a set of USRPs for receiving samples at a specified frequency, samples rate, gain, etc…
5) sigproc_avg_bw_pwr - application for processing received samples and writing in OML database
Source files for the streaming applications are located here
Receive multi channel signal for processing and plotting
1) From the grid console, image the controller node then turn on all the USRPs (on the MIMO rack) and the controller node.
nilanjan@.grid:~$ omf load -i nilanjan@.grid:~$  -t node21-1
nilanjan@.grid:~$ omf tell -a on -t [[21,1],[23,1..8]]
2) Set up tunneling via ssh from your local port 5100 to the grid.orbit-lab.org:5100
my_laptop> ssh -L 5100:grid.orbit-lab.org:5100 username@grid.orbit-lab.org
3) Verify that Webproxy is running (this is required for remote web based streaming)
nilanjan@.grid:~$ run-websock 5100 localhost:5101 --daemon
WebSocket server settings:
  - Listen on :5100
  - Flash security policy server
  - No SSL/TLS support (no cert file)
  - Backgrounding (daemon)
4) Open a ssh session into the controller node and run the hardware interface application to start streaming the receiver. The list of USRP devices, frequency, rate, gain, etc.. are all described in the XML file.
root@node21-1:> ./rf_hw_intf --conf "devices.xml,/devices/mimo_rx" --rx-only --cmd-port 5111


linux; GNU C++ version 4.8.4; Boost_105400; UHD_003.010.001.000-0-unknown

 INFO  10:31:34.189 (rf_hw_intf.cpp:820) - Starting command server at 5111
Creating the usrp device: addr0=10.10.23.1,addr1=10.10.23.2,addr2=10.10.23.3,addr3=10.10.23.4,addr4=10.10.23.5,addr5=10.10.23.6,addr6=10.10.23.7,addr7=10.10.23.8,
-- X300 initialization sequence...
-- Determining maximum frame size... 7972 bytes.
-- Setup basic communication...
-- Loading values from EEPROM...
-- Setup RF frontend clocking...
-- Radio 1x clock:200
:
:
:
........ INFO  10:30:18.921 (rf_hw_intf.cpp:640) - rxchan all
 INFO  10:30:18.921 (rf_hw_intf.cpp:713) - rxchan 0 4000000000 4000000 20

 INFO  10:30:18.922 (rf_hw_intf.cpp:713) - rxchan 1 4000000000 4000000 20

 INFO  10:30:18.922 (rf_hw_intf.cpp:713) - rxchan 2 4000000000 4000000 20
5) Open another ssh session into the controller node and run the sample processing application. This application measures the average bandwidth power of the received samples and writes the measurements into the OML database.
root@node21-1> ./sigproc_avg_bw_pwr --time 100
:
:
TCP connection to localhost:5111 ready!
Feb 14 10:18:52 INFO    OML Client V2.10.1rc [Protocol V4] Copyright 2007-2013, NICTA
[15.8042]
64k fft, mag, norm, sum-----total time 0.00127201
ch: 0 --- avg pwr = -112.993
INFO    OmlNetOutStream: attempting to connect to server at tcp://oml:3003
64k fft, mag, norm, sum-----total time 0.00111798
ch: 1 --- avg pwr = -112.681
64k fft, mag, norm, sum-----total time 0.00106562
ch: 2 --- avg pwr = -112.759
64k fft, mag, norm, sum-----total time 0.00106355
:
:
INFO    tcp:oml:3003: Waiting for buffered queue thread to drain...
Done!
6) Run the box plotting server on the console. This server will query measurements from the OML database and forward to webpage display.
nilanjan@.grid:~$ box-plot-server --port 5101 --file /var/lib/oml2/measured_avg_bw_pwr.sq3

 INFO  11:39:00.355 (main.cpp:240) - Starting the server at
 INFO  11:39:00.356 (main.cpp:179) - Starting command server at 5101
7) Finally if everything is working correctly, the measured power across different channels can be view from a Chrome browser - click me :)
Transmit a signal using a single usrp
While the above receiving end is running, transmit a signal from another usrp on the grid. To do this select a node(s) to use as a transmitter and load this node with the same image as node21-1. For this example we'll use the usrp on node19-1 with the tuning parameters described under /devices/grid_tx in devices.xml. Run the hardware interface application in the transmit direction.
root@node19-1:> ./rf_hw_intf --conf "devices.xml,/devices/grid_tx" --tx-only --cmd-port 5112
Create a signal consisting of a short sync sequence followed by a signal with phased-shifted angles and transmit this sequence every 500 microseconds.
root@node19-1:> samps="octave -qf sync.m";
root@node19-1:> ./sigtran --sig "`$samps`" --intv 500
Upon transmission of the signal, the boxplot of the received signal strength will update to reflect the transmitted signal.
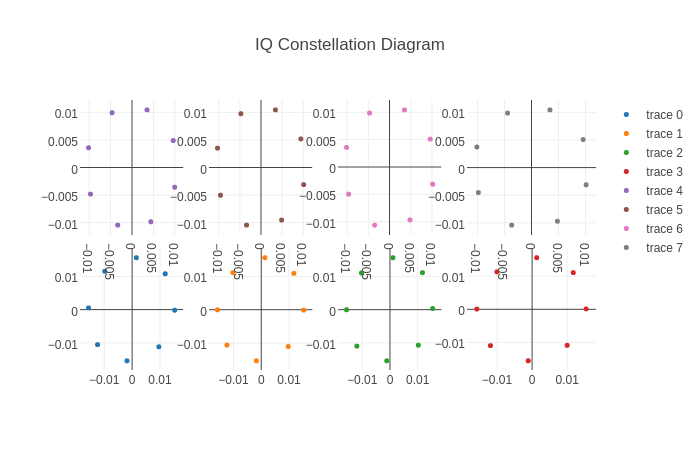
Plot the IQ Constellation of received signal
Halt the signal transmission and rerun the signal transmission app with a half second internal.
root@node19-1:> samps="octave -qf sync.m";
root@node19-1:> ./sigtran --sig "`$samps`" --intv 500
2) Set up tunneling via ssh from your local port 5101 to the grid.orbit-lab.org:5101
my_laptop> ssh -L 5101:grid.orbit-lab.org:5101 username@grid.orbit-lab.org
3) Start another web proxy daemon from the console
nilanjan@.grid:~$ run-websock 5101 node21-1:5101 --daemon
WebSocket server settings:
  - Listen on :5101
  - Flash security policy server
  - No SSL/TLS support (no cert file)
  - proxying from :5101 to node21-1:5101
4) Make sure the prior signal processing app is stopped. Launch the next processing application with the parameters shown below to start tracking the transmitted sync sequence and trace the phased shifted samples following it.
root@node21-1> sync="octave -qf sync.m";
root@node21-1> ./sigproc_start_idx --sync  "`$sync`" --cmd-port 5101 --time 900
5) If all goes well click here to view the updating constellation plot of the received signal.
Multi-channel Uhd STreamer (MUST)
Description
A high-level application to stream real-time samples from multiple IP addressable USRP devices.
How it works (without going into the source-code 
Application is split into two run-time objects:
1) hardware interface application - talks to radio and manages sample streaming
2) signal handler application - a customized application to process streams samples.
The hardware interface application controls and initializes the USRP devices with configuration parameters, enables a remote-commander for run-time query and limited parameter updates and configures a circular queue of shared memory buffers (similar to IPC) for continuous real-time sample streaming to/from the device. At the moment this can run in one mode: receive OR transmit streaming. This object uses an XML file containing a list of devices with configuration parameters to set up all the devices. Once all the devices are configured, this starts a continuous receive / transmit streaming thread for the signal handler application.
The second object attaches to the already created shared memory buffer and allows customized processing of the streaming samples in the receive direction or construction of samples in the transmit direction.
Source code & compilation
Download the source code from here.
Install the required libraries using the package manager and then use make to generate the executable.
> apt-get update
> apt-get install libboost-all-dev libpugixml-dev libpugixml1 liblog4cxx10 liblog4cxx10-dev

> make
Upon successful compilation the following apps will be generated:
1) rf_hw_intf - the hardware interface application
2) sigproc_avg_bw_pwr - example signal handler application for processing received samples
3) sigtran - example transmit side signal handler application for transmitting
Hardware interface application
The rf_hw_intf must be specified with an an xml file for device configuration and direction for sample processing. For a list of arguments use —help:
linux; GNU C++ version 4.8.4; Boost_105400; UHD_003.010.001.000-0-unknown

Multi-channel Uhd STreamer v000.001.000
 Allowed options:
  --help                 help message
  --conf arg             specify xml device configuration file and path
                         "devices.xml,/devices/active"
  --print-conf           print device conf
  --rx-only              enable receive direction only
  --tx-only              enable transmit direction only
  --cmd-port arg (=5180) command server port
XML file
The XML file template is described below. A description of the xml nodes and attributes are in the table.
 <devices>
  <_grp_rx_ sync="now" rx_freq="1900e6" rx_rate="5e6" rx_gain="10">
    <device type="n210" ip="192.168.101.102">
      <ch rx_bw="25e6" rx_ant="RX2"
          tx_gain="20" tx_bw="25e6" tx_ant="TX/RX" />
    </device>

    <device type="x310" ip="10.10.23.2">
      <ch rx_bw="25e6" rx_ant="RX2"
          tx_gain="20" tx_bw="25e6" tx_ant="TX/RX" />
    </device>
  </_grp_rx_>
 <devices>
Group (parent) nodes / attributes Description _grp_rx specify a group name for a cluster of devices sync clock/time source options
now - use internal clock,
pps - use external clock and external time source
Device (child) nodes / attributes Description device specifies a unique radio type device category
b200 - this USB based devices. ie. no IP address
n210 - IP addressable, must specify sttribute: ip
x310 - IP addressable, must specify sttribute: ipip address of device
Group / channel attributes,
channel attribute takes precedenceDescription ch specifies a unique radio within device rx_freq receiver carrier frequency rx_gain receiver gain rx_rate receiver rate rx_bw receiver bandwidth rx_ant receiver antenna options:
TX/RX
RX2tx_freq transmit carrier frequency tx_gain transmit gain tx_rate transmit rate tx_bw transmit bandwidth tx_ant transmit antenna options:
TX/RX
Command server
The command server can be used to communicate with the application and issue a limited set of control and query commands. This a way to remotely control the device settings during runtime.
RC commands Description rxfreq all get rx carrier frequency for all channels rxgain all get rx gain for all channels rxrate all get rx rate for all channels rxfreq all <freq> set rx carrier frequency for all channels rxgain all <gain> set rx gain for all channels —— set rx rate is not supported during runtime
txfreq all get tx carrier frequency for all channels txgain all get tx gain for all channels txrate all get tx rate for all channels txfreq all <freq> set tx carrier frequency for all channels txgain all <gain> set tx gain for all channels —— set tx rate is not supported during runtime
Usage Example
To stream samples in the receive direction from the device group in /devices/mimo_rx with a command server listening on port 5111.
node21-1> ./rf_hw_intf --conf "mimo1.xml,/devices/mimo_rx" --rx-only --cmd-port 5111
Stream samples in the transmit direction:
node1-1> ./rf_hw_intf --conf "devices.xml,/devices/grid_tx" --tx-only --cmd-port 5112
Use the python script to run commands via the hardware interface's command port:
console> python rc.py node21-1 5111 "rxfreq all"
console> python rc.py node21-1 5111 "rxfreq all 2800e6"
Signal handler applications
The signal handler application attaches the shared memory buffer allocated by the hardware interface app. Both receive and transmit direction have separate shared memory buffers. The signal handler applications are meant to be run for several iterations without stopping the hardware interface.
An example of a receive direction signal handler is provided. Running is app will attach to the receive side shared memory buffer and perform some processing on the received samples. This app (or some variation of it with a different signal handler) can be run for several iterations without stopping the hardware interface application.
node21-1> ./sigproc_avg_bw_pwr --time 15
Likewise a signal handler for the transmit direction is provided as an example. This attaches to the transmit direction shared memory buffer and populates with predefined samples passed in as an argument.
node1-1> samps="octave -qf awgn256.m"
node1-1> ./sigtran --sig "`$samps`" --intv 500
Tutorials
- Multi Channel Sample Processing & Visualization
Attachments (5)
- view_sync_sig.png (16.4 KB ) - added by 9 years ago.
- view_sync_sig.2.png (10.0 KB ) - added by 9 years ago.
- mimo_rx.png (49.1 KB ) - added by 9 years ago.
- mimo_rx_scatter.png (40.7 KB ) - added by 9 years ago.
- js_scatterplot.html (6.0 KB ) - added by 9 years ago.
Download all attachments as: .zip


