Body Sensor Networks
Table of Contents
- 2015 Winlab Summer Internship
- LTE Unlicensed (LTE-U)
- Introduction
- Objectives
- Theory
- Analyzing Tools
- Experiment 1: Transmit and Receive LTE Signal
- Experiment 2: The Waterfall Plot
- Experiment 3: eNB and UE GUI
- Experiment 4: Varying Bandwidths
- Experiment 5: Working with TDD or FDD
- Experiment 6: TDD with Varying Bandwidths
- Experiment 7: TDD Waterfall Plot
- Poster
- Members
- Materials
- Resources
- LTE Unlicensed (LTE-U)
- Body Sensor Networks
- Dynamic Video Encoding
Introduction
Biological data is increasingly easy to collect with the development of simpler and cheaper biosensors. This type of data has important implications for the future of healthcare, health monitoring, and physiologically integrated technology. The goal of this project is to develop an integrated platform for the analysis of various types of biological data, which can be used to classify and analyze new data, as well as employ biological data for practical applications ranging from diagnosis to physiologically responsive devices, and more.
Project Overview
In order to accurately classify and analyze biological data, a number of functions are needed. In particular, known characteristic patterns visible in data such as EEG (electroencephalography) or EKG (electrocardiography) must be recognized by the system in order to make reasonable decisions.
The recognition of such patterns requires statistical manipulation of the data in order to identify important features.
The current focus of this project is to research appropriate transformations that can be applied to data in order to extract key features. These features can then be analyzed by an algorithm trained on datasets exhibiting characteristic patterns to classify novel data.
Data Collection
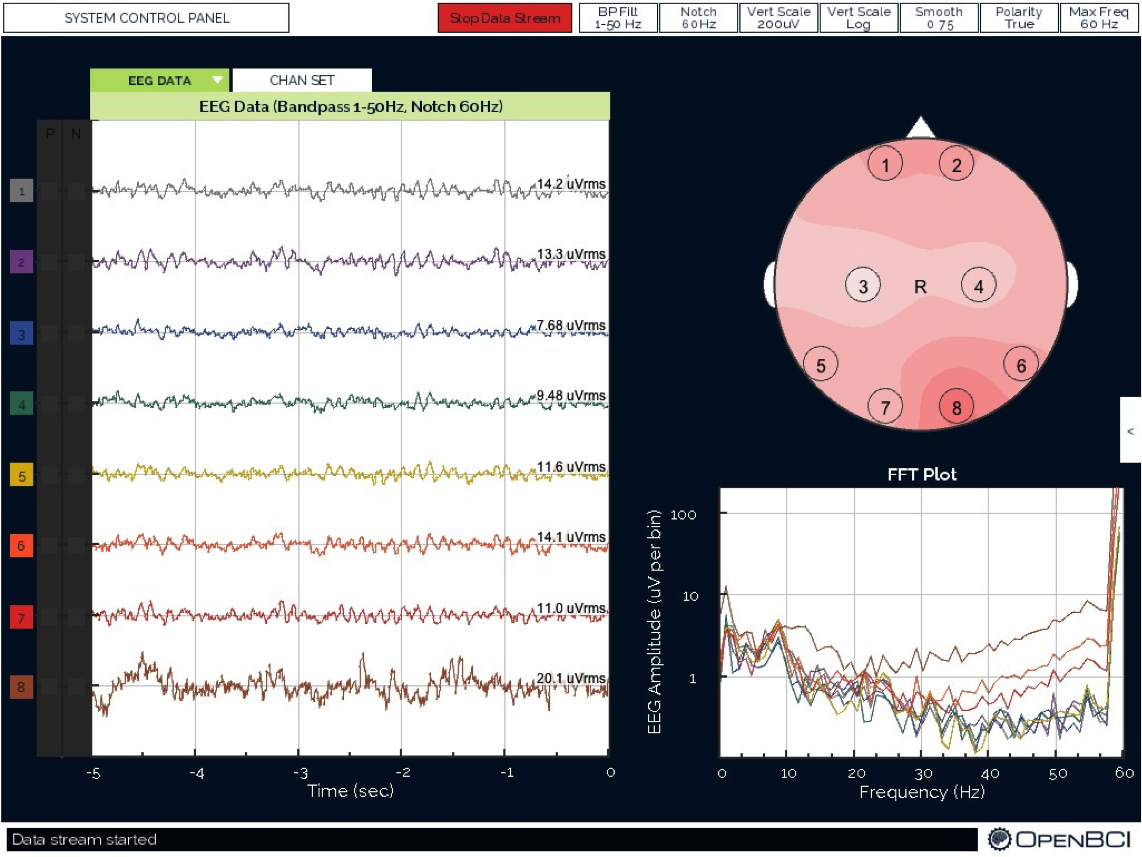
Data was collected using the OpenBCI open source bioelectric recording platform.
Initial BCI data
Experimental setup:
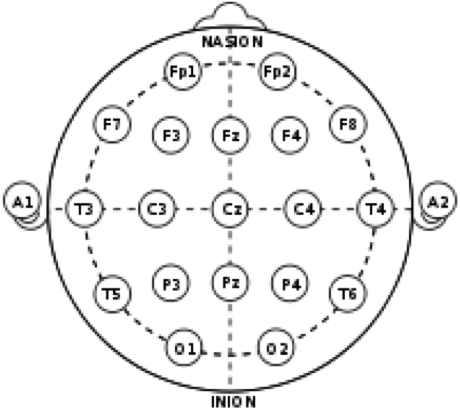
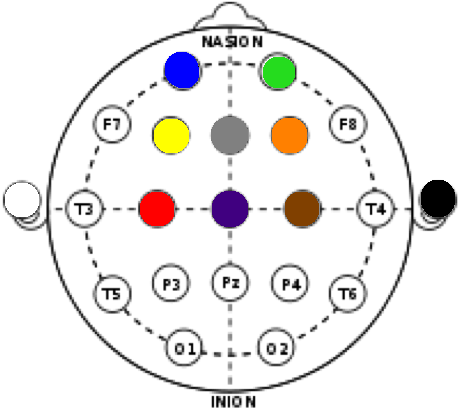
The images below show a general EEG headplot, mapping commonly used electrode locations, as well as a marked-up headplot showing the electrode locations used for collecting the data for this experiment.
The colors correspond to electrode colors, which correspond to graphics created by the OpenBCI GUI. Below is a sample image of data collection in the OpenBCI GUI. The black and white ear electrodes (A1 and A2) are ground and reference electrodes for the others.
Electrode locations were chosen for relevance to movement/ motion intention. C3, Cz, and C4 are associated with sensorimotor integration. F3 and F4 are associated with motor planning. These are the central nodes. Fp1 and Fp2 are associated with attention and judgement, while Fz is associated with working memory.
Data collected was as follows:
5 samples rest (10 sec each)
10 samples up
10 samples down
10 samples right
10 samples left
(up, down, left, right represent direction of imagined motion; each sample includes 3 sec prep and 3 sec imagined movement)
Data Analysis
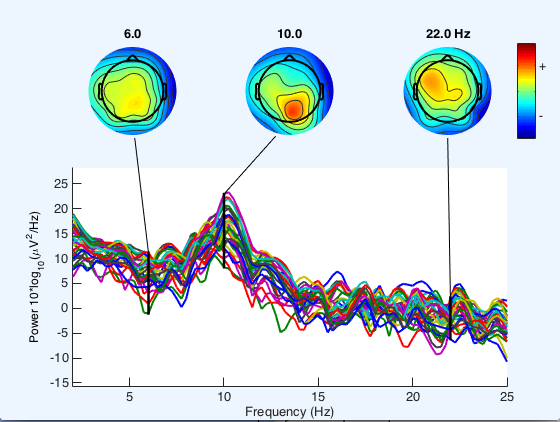
Data analysis (for EEG/ BCI data) is being done through EEGLAB and BCILAB toolboxes for MATLAB (from the Scwartz Center for Computational Neuroscience). Sample data was initially used to create channel spectra maps (and other data visualizations) using the EEGLAB interface.

Tools/ Resources
The R Project for Statistical Computing
Attachments (4)
- headplot.png (88.2 KB ) - added by 11 years ago.
- headplot_mapped.png (77.8 KB ) - added by 11 years ago.
- openBCIUI.png (706.6 KB ) - added by 11 years ago.
- Channel Spectra.png (101.5 KB ) - added by 11 years ago.
Download all attachments as: .zip


